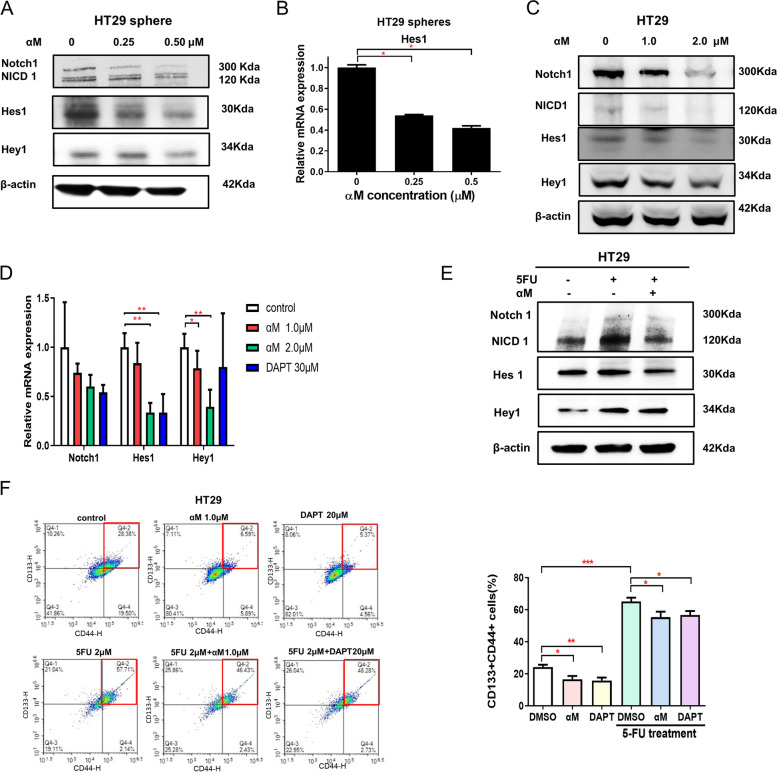
Fig. 3.
αM inhibited CSCs through the NOTCH-HES1 pathway. A Western blot showing protein levels of Notch1, NICD1, Hes1, Hey1, and β-actin in HT29 spheres treated with αM at different concentrations. Notch was downregulated upon treatment with 0, 0.25, and 0.5 μM αM in a concentration-dependent manner. B Quantitative real-time PCR showing the mRNA levels of Hes1 in HT29 spheres treated with 0, 0.25, and 0.5 μM αM for 14 d. Hes1 mRNA was downregulated following treatment with αM in sphere-forming assay. N = 3 (C) Western blot analysis for Notch1, NICD1, Hes1, Hey1, and β-actin with HT29 cells treated with αM at various concentrations. αM downregulated Notch1, NICD1, Hes1, and Hey1 in a concentration-dependent manner. D mRNA expression of Notch pathway factors: Notch1, Hes1, and Hey1 expression was quantified in HT29 cells through quantitative real-time PCR. αM downregulated Notch1, Hes1, and Hey1. N = 6 Data are expressed as mean ± SD values. E Western blot showing the protein levels of Notch1, NICD1, Hes1, Hey1, and β-actin in HT29 cells treated with or without 2 μM 5-FU and 1.0 μM αM. F Expression of CD44 and CD133 (CSC markers) was analyzed with or without 5-FU treatment through flow cytometry, using αM or DAPT. HT29 cells were treated with 1.0 μM αM and DAPT with or without 5-FU for 72 h for 11 times. The proportion of CD133+CD44+ cells was significantly decreased with both αM and DAPT. In addition, the 5-FU–induced increase in CD133+CD44+ cells was significantly attenuated by αM and DAPT treatment. N = 11 Data are expressed as mean ± SEM values; *P < 0.05, **P < 0.01, ***P < 0.001

