Fig. 6.
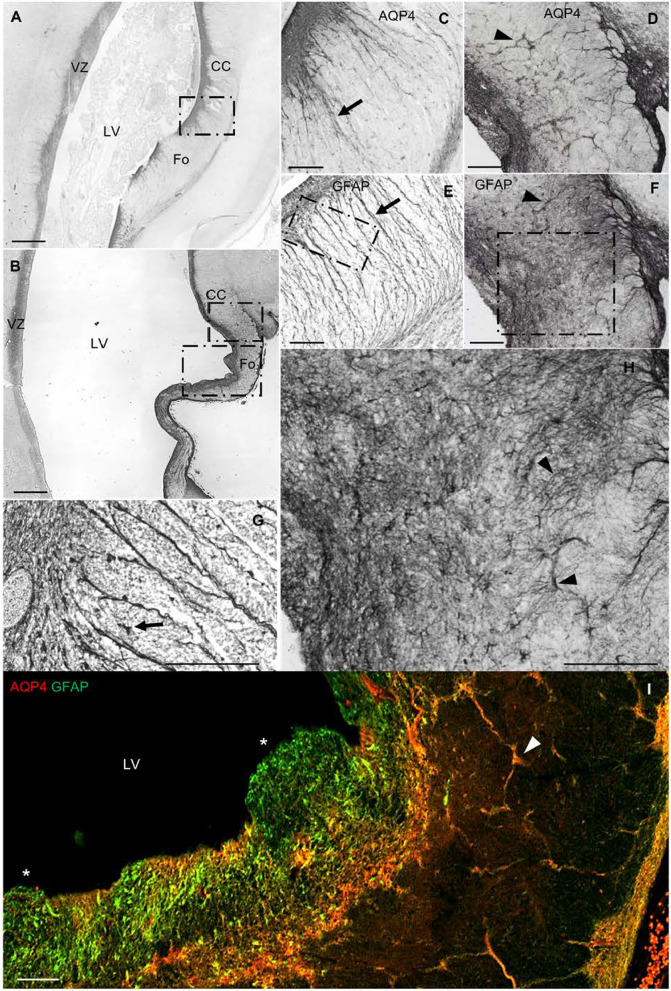
Expression of AQP4 and GFAP in control vs. hydrocephalic fetuses. a Panoramic image of a coronal section of a control brain at 21 PCW. b Panoramic image of a coronal section (same region as in a) from a brain with myelomeningocele at 21 PCW. c Magnification of the square in a, showing the ventricular area adjacent to the fornix and the corpus callosum in a control case. d Magnification of the ventricular area adjacent to the fornix and CC in a case with myelomeningocele complicated with hydrocephalus. e Slide stained in parallel with c for GFAP. f Slide stained in parallel with d for GFAP. Arrows point to glial radial cells. Arrowheads point to disorganized glial radial cells. g Detail of the control case with anti-GFAP. Arrow points to an undifferentiated GFAP-positive cell. h Image of the same region as in g from a patient with myelomeningocele complicated with hydrocephalus, immunostained with anti-GFAP. Arrowhead points to a differentiated astrocyte showing signs of reactive astrogliosis. i Slide stained in parallel with b, double-labeled with anti-GFAP and anti-AQP4. Asterisks mark VZ disruption. Arrowheads point to disorganized glial radial cells. CC, corpus callosum; Fo, fornix; LV, lateral ventricle; VZ, ventricular zone. Scale bar: a, b 500 µm; c–h 140 µm; i 80 µm

