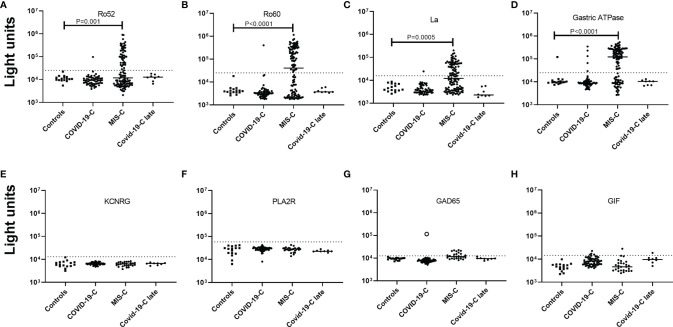
Figure 2.
Many children with MIS-C treated with IVIG show a high prevalence of autoantibodies against Ro52, Ro60, La, and gastric ATPase. (A–D) Autoantibody levels against Ro52, Ro60, La, and gastric ATPase were determined in 16 children not infected with SARS-CoV-2 (Controls), 59 children with COVID-19 (COVID-19-C), 116 serum/plasma samples from 54 children with MIS-C, and 8 children who recovered from acute COVID-19 (COVID-19-C late). Each symbol represents a sample from an individual patient or different time points from an individual patient (A–D) Autoantibody levels against four autoantigens, KCNRG, PLA2R, GAD65, and GIF (E–H) were tested in the same children as in panels (A–D), except for MIS-C children where a single sample from the time of peak Ro52, Ro60, La, and/or gastric autoantibodies was used. Autoantibody levels are plotted on the Y-axis in light units on a log10 scale and the solid horizontal line represents the mean value in each group The dashed lines represent the cutoff levels for determining positive autoantibody levels for each target antigen as described in the Methods. The sample from the child with acute COVID-19 with high levels of GAD65 autoantibodies is denoted by the open black circle. Only statistically significant P values from the Fisher exact test examining autoantibody prevalence differences between the controls and the groups of COVID-19 and MIS-C children are shown.

