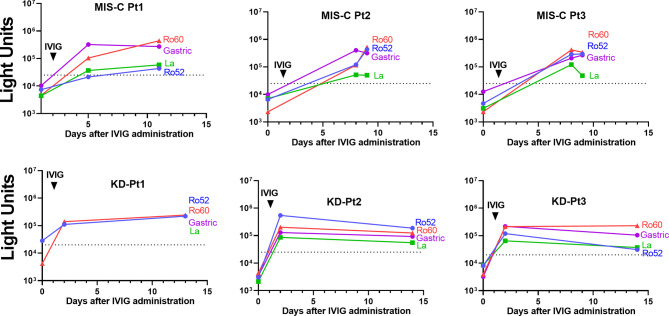
Figure 4.
Longitudinal autoantibody profiles before and after administration of IVIG in MIS-C and KD patients. Antibody levels were determined in serial samples from representative MIS-C (MIS-C, Pt1-3) and KD patients (KD, Pt1-3), in which time zero represents the day of hospital admission. The autoantibody profiles for Ro52 (blue), Ro60 (red), La (green), and gastric ATPase (purple) are shown by the colored lines, in which the cut-off value for determining positivity is shown by the dotted lines. The arrow shows the day when IVIG was administered.

