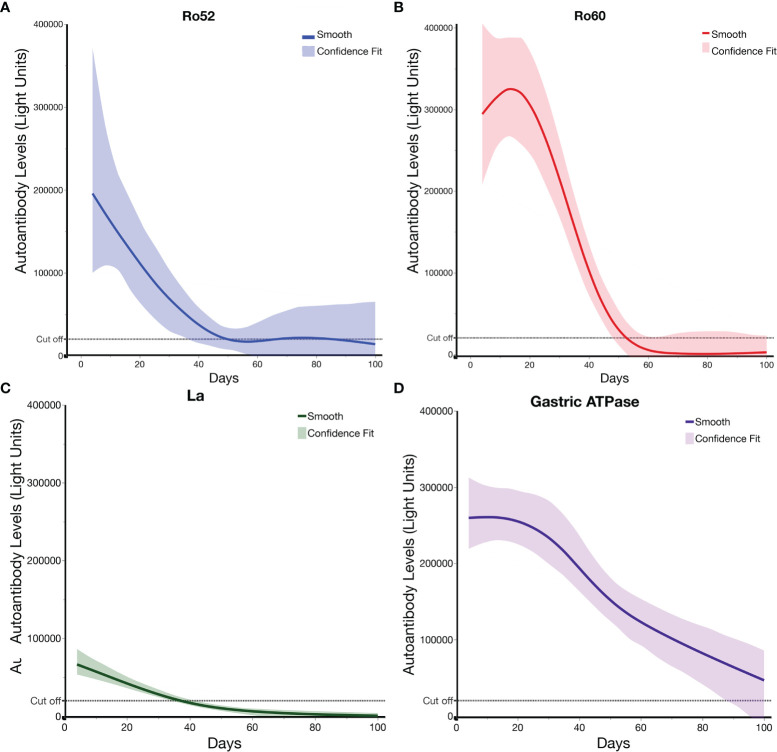
Figure 5.
Ro52, Ro60, La, and gastric ATPase autoantibody decay in patients with MIS-C receiving IVIG. Decay plots (A–D) were generated for Ro52, Ro60, La, and gastric ATPase (ATPB4) autoantibody data from the MIS-C (n = 21) patients having two or more different time points. Day 0 is the time the patients received IVIG. The solid-colored line for each autoantigen indicates the decay obtained using JMP® 14.0.0 and a smoothing spline (cubic spline) with a λ of 0.77 with the shaded area representing the bootstrap confidence region for each fit. The dotted lines indicate the cut-off value for determining seronegativity for each autoantigen.

