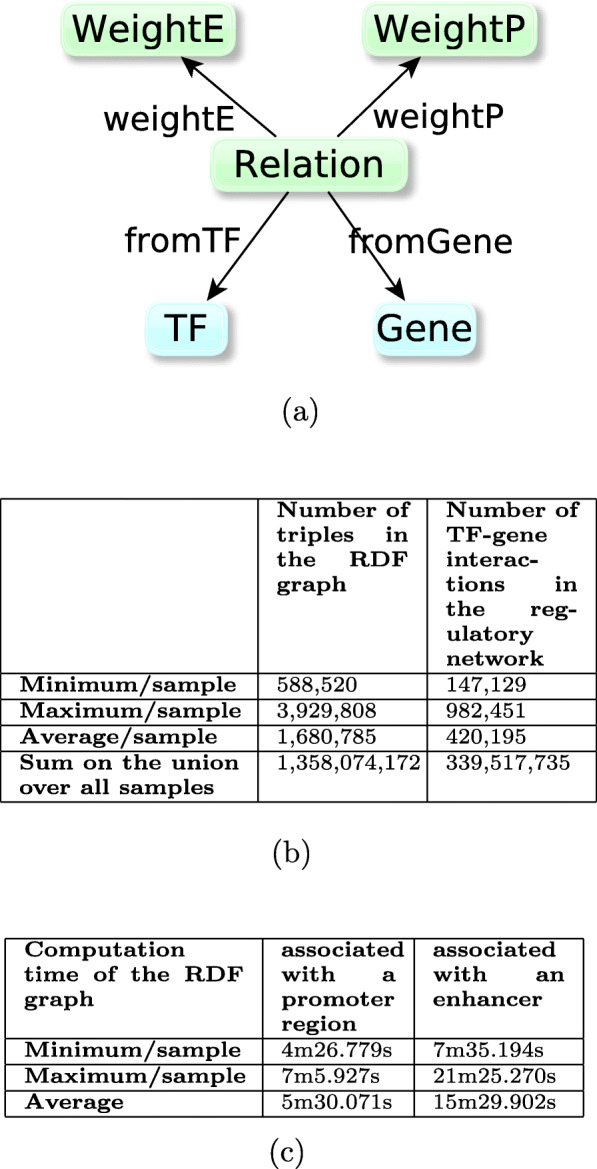
Fig. 4.

a RDF-model for each sample-specific graph: boxes represent classes of entities; a relation between a TF and a gene is characterized by (i) WeightP, the score which models the ability of the regulation to be operated through a promoter region, and (ii) WeightE, the score which models the ability of the regulation to be operated through an enhancer region. At least one of these scores has a nonzero value. b Description of the content of the 808 sample TF-gene regulatory networks. Each network is represented by an RDF graph based on the RDF model described in (a). The number of TF-gene interactions in the corresponding regulatory network is the number of instances of the “Relation” class in the graph. c Execution times of the SPARQL queries Insert_Enhancer.rq and Insert_Promoter.rq (cf. Fig. 2 and github repository) for contructing the graphs in (b), calculated for the first 102 samples. Structure of the 808 sample-specific graphs representing the parameters of the TF-gene regulation relations
