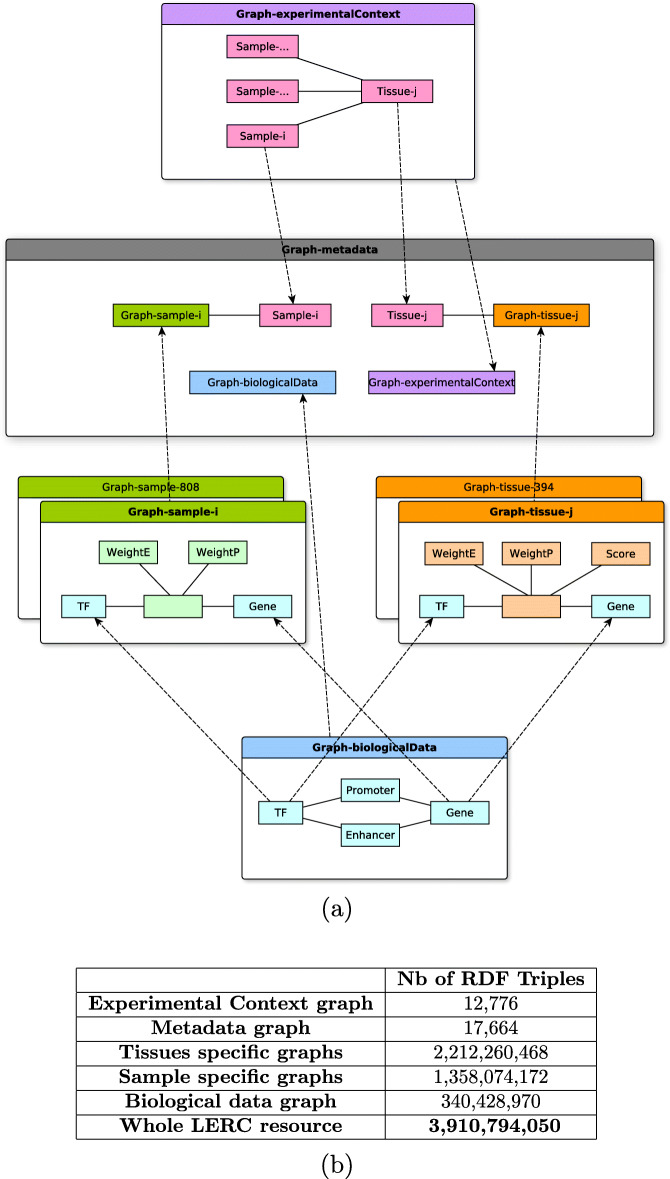
Fig. 6.
a The named graphs are the labelled boxes. Within them, the plain boxes and edges represent a simplified view of the main classes of each graph and their relations. The dotted edges represent how named graphs are linked: they relate identical URIs of entities in two different graphs. b Population in number of triples of the different graphs constituting the LERC resource. Number of triples for sample-specific and tissue-specific graphs given as the union of all the graphs of the given category. Modular organization of the RDF dataset into 1,205 named graphs

