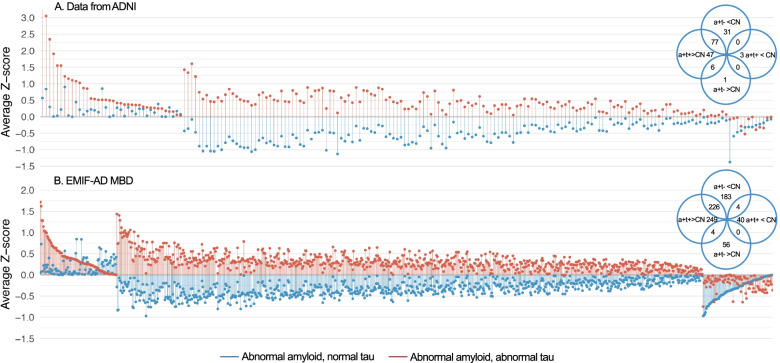
Fig. 1.
Protein concentrations relative to control group in individuals with AD according to t-tau status. Protein concentrations of individuals with abnormal Aβ1-42 and increased t-tau (a + t + , red) and abnormal Aβ1-42 and normal t-tau (a + t-, blue) in ADNI A and EMIF-AD MBD B. Concentrations are expressed as z-score relative to the control group (CN) that had normal cognition, normal Aβ1-42 and normal t-tau. Proteins are sorted according to change relative to control group. Shown are proteins that differed between individuals with AD with increased t-tau or AD individuals with normal tau from controls. Venn diagram shows number of proteins that differed

