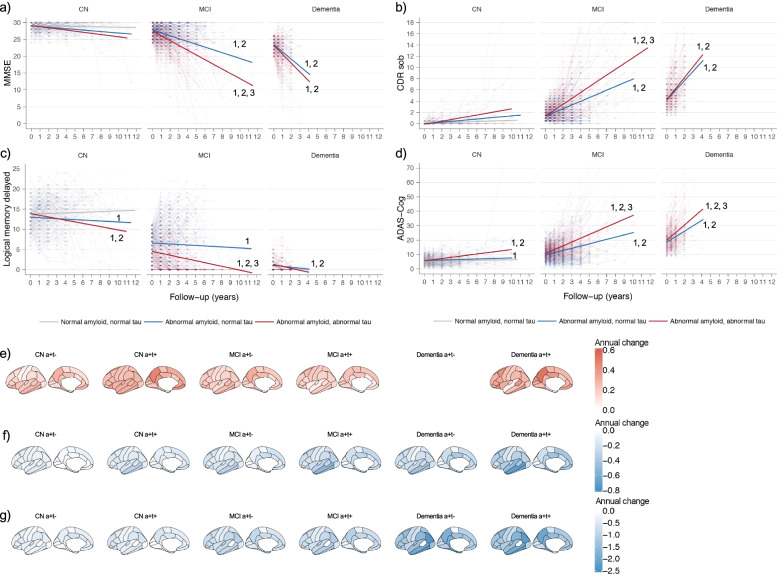
Fig. 5.
Longitudinal cognitive and imaging changes according to diagnostic group and clinical stage Upper images: change in cognitive markers. A MMSE, B CDR sum of boxes, C Logical memory, and D ADAS-Cog. Change of controls are shown in grey, of AD individuals with increased t-tau in red (a + t +), and of AD individuals with normal t-tau (a + t-) in blue. 1. Slope p < 0.05 different from control; 2. Slope p < 0.05 different from 0; 3. Slope p < 0.05 different between AD individuals with increased t-tau (a + t +) and AD individuals with normal t-tau (a + t-). Lower images: Annual rate of change in imaging markers. E amyloid aggregation, F cortical thickness and G FDG-PET glucose metabolism. PET amyloid data are not shown for AD individuals with dementia with normal t-tau because of low number of participants (n = 6). Data are shown in Data S6. Data are from ADNI only. CN = normal cognition; MCI = mild cognitive impairment; a + t + = abnormal Aβ1-42 and increased t-tau; a + t- = abnormal Aβ1-42 and normal t-tau

