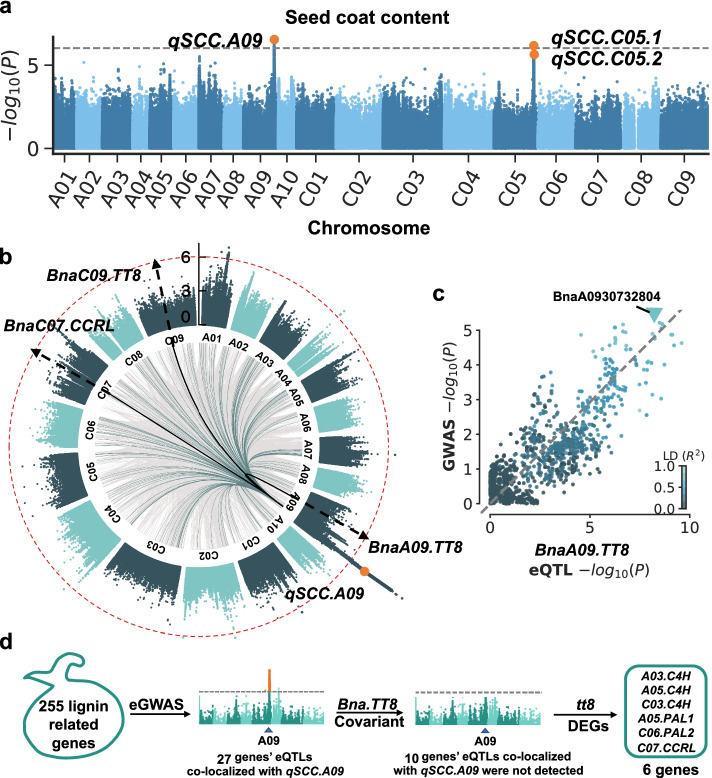
Fig. 3.
The regulatory hotspot on chromosome A09 affects SCC. a Manhattan plot of GWAS results for SCC. Three significant QTLs are denoted. b Manhattan plot of GWAS results for expression value of BnaA09.TT8, BnaC09.TT8 and BnaC07.CCRL. The SCC QTLs qSCC.A09 identified by GWAS are denoted. Significant eGWAS associations for TWAS-significant genes at 40 DAF are marked (gray lines); associations co-localized with qSCC.A09 are highlighted in green. BnaA09.TT8, BnaC09.TT8 and BnaC07.CCRL localization results are highlighted in black. c The log-transformed P values form GWAS plotted against those for variants from eGWAS of qTT8.A09 (around qSCC.A09 lead SNP 150 kb). d Flowchart of screening of putative phenylpropanoid and lignin synthesis-related genes regulated by BnaTT8s. Based on the eGWAS results of phenylpropanoid and lignin synthesis-related genes, whose eQTLs co-localized with qSCC.A09 were detected. eQTLs of some genes were not detected to be co-localized with qSCC.A09 using BnaTT8s as a covariate. Among these genes, differentially expressed genes when BnaTT8s were mutated were identified

