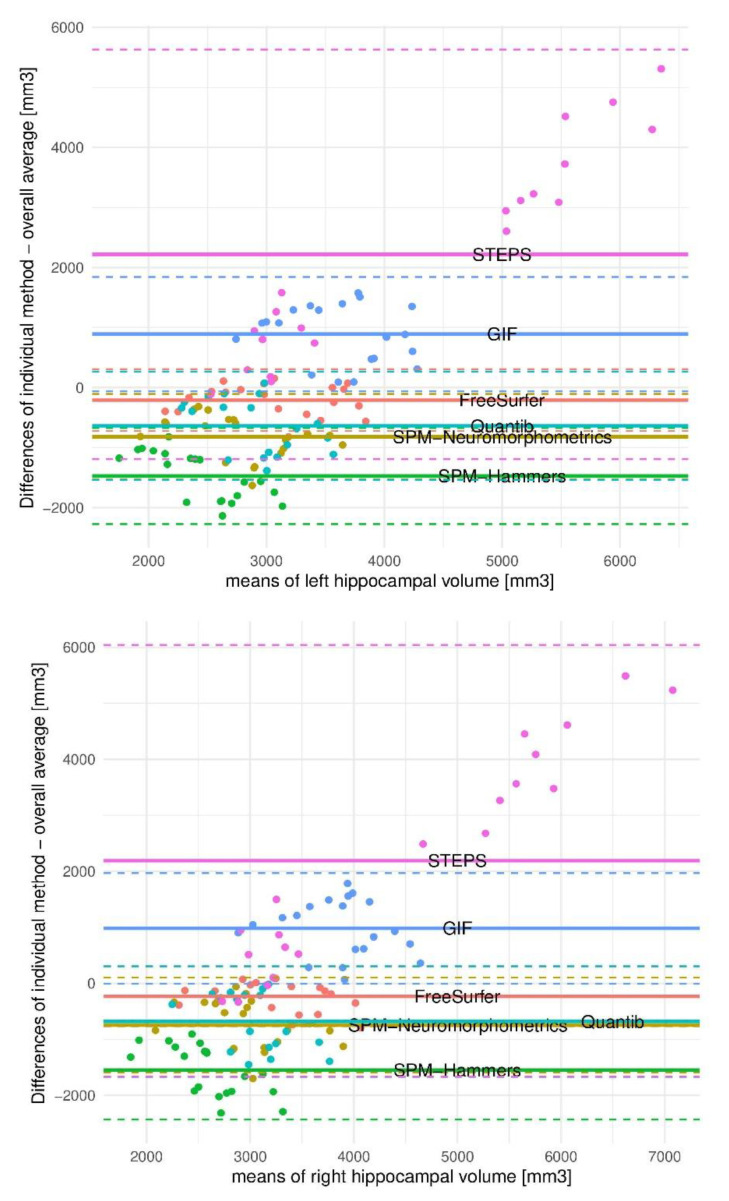
Figure 2.
Bland–Altman plots of the relation of hippocampal volumetric measurements resulting from one single method to the overall methods. Legend: The transversal color-coded continuous line parallel to the x- axis visualizes the mean of differences of single method means to the overall mean. A line along the 0 values would be the optimum, as it is near the mean of all methods. The discontinuous line depicts the limitations of agreement, which varies substantially between the methods. STEPS reveals a great spread in data and measures the highest values compared with the mean. However, this method forms two clusters, one including subjects, the other controls, therefore yielding a good separation between pathological and normal. Abbreviations: SPM = Statistical Parametric Mapping software; GIF = Geodesic Information Flows software; STEPS = Similarity and Truth Estimation for Propagated Segmentations.

