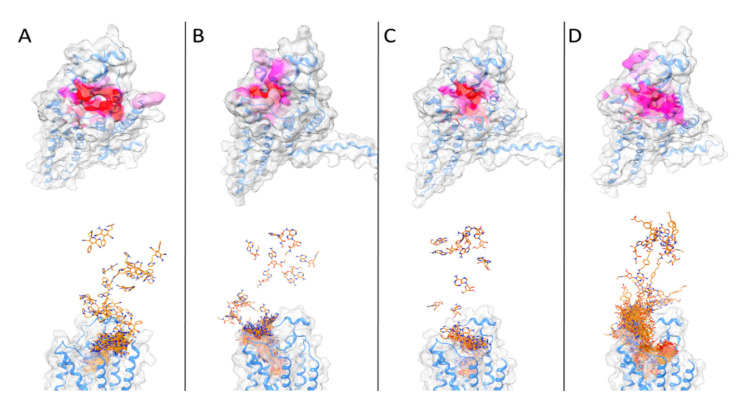
Figure 7.
In the upper part of the figure, the protein surface is colored according to the number of contacts with the ligand during the trajectory (scale white to red, from less contacted to more contacted residues). In the lower part, the SuMD trajectory is displayed superposing each frame. (A): LUF5833; (B): NECA; (C): Adenosine; (D): CGS21680.

