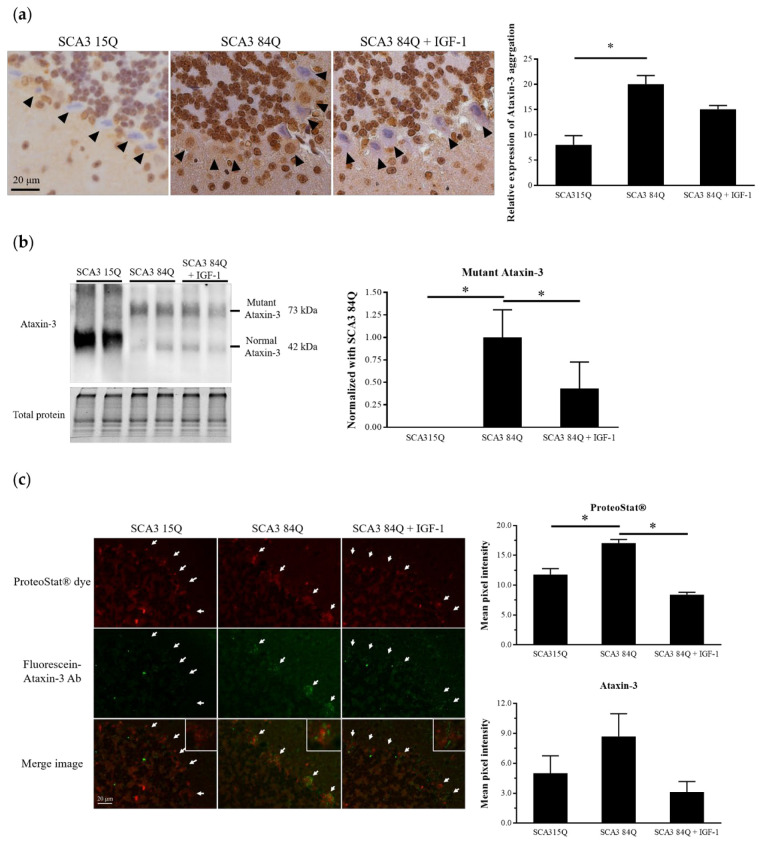
Figure 3.
IGF-1 reduced the ataxin-3 protein level in the cerebellum of the SCA3 84Q mice. (a) Immunochemical staining of ataxin-3 in the cerebellum. The black arrows indicate PCs (right panel). Histograms show the means ± SEM (left panel). SCA3 15Q, n = 4; SCA3 84Q, n = 4; SCA3 84Q + IGF-1, n = 5. (b) Western blot confirming ataxin-3 expression in the mouse cerebellum (left panel). Quantification of the ataxin-3 level relative to the total protein level (mean ± SEM) (right panel). SCA3 15Q, n = 4; SCA3 84Q, n = 4; SCA3 84Q + IGF-1, n = 5. (c) Slices of the cerebellum of two mice in each group were selected and double-labeled using an aggresome detection kit (red) and an Alexa 488-conjugated secondary IgG against the anti-ataxin-3 antibody (green), and fluorescence intensities of 30–40 PCs in each mouse were examined using the ImageJ software. The white arrows indicate PCs. SCA3 15Q, n = 2; SCA3 84Q, n = 2; SCA3 84Q + IGF-1, n = 2. Note: * p < 0.05 indicates a significant difference.

