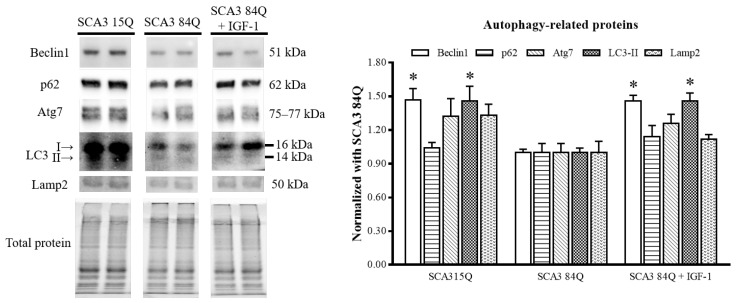
Figure 4.
Expression of the autophagic influx in the SCA3 mice. Representative Western blots of the autophagy-related markers (right panel). Quantitative results of the autophagy-related proteins were normalized to those of total protein (mean ± SEM) (left panel). SCA3 15Q, n = 4; SCA3 84Q, n = 4; SCA3 84Q + IGF-1, n = 4. Note: * p < 0.05 indicates a significant difference.

