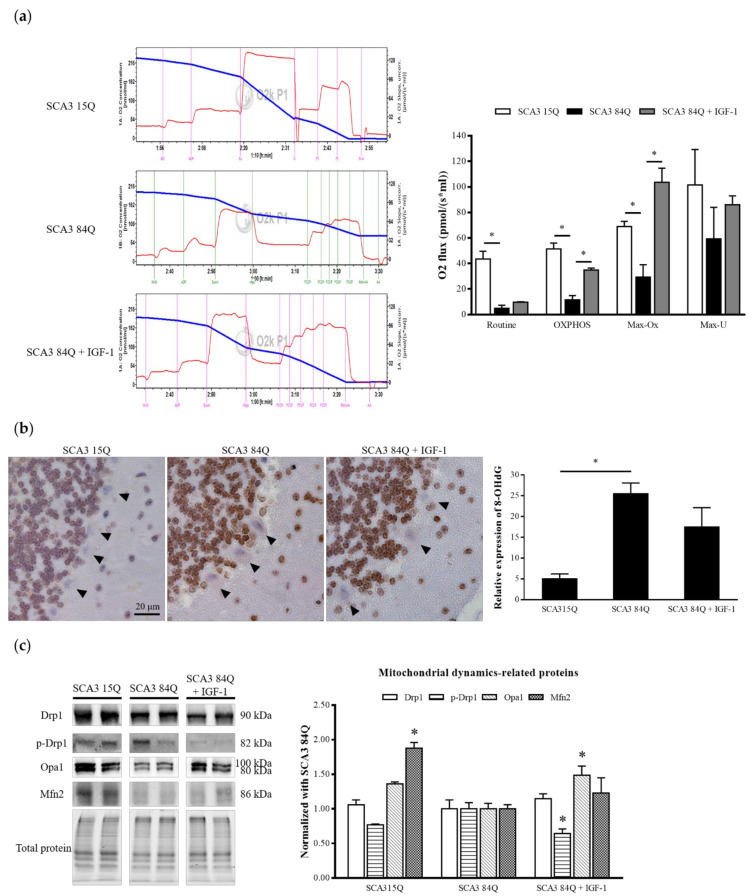
Figure 5.
Expression of the mitochondrial function in the SCA3 mice. (a) Typical trace of respirometry measurements recorded using an Oroboros O2k with 2 mg/mL of the cerebellum. The blue curve indicates the oxygen concentration in the sealed chamber, whereas the red curve shows the oxygen consumption of tissue cells (left panel). Oxygen consumption of cells at different mitochondrial stages was corrected for ROX, and the respiratory capacities in the routine, OXPHOS, Max-Ox, and Max-U states were plotted as the means ± SEM (right panel). SCA3 15Q, n = 3; SCA3 84Q, n = 3; SCA3 84Q + IGF-1, n = 2. (b) The 8-OHdG protein expression in the cerebellum sections by IHC staining analysis; the arrows indicate PCs (left panel). Histogram shows the mean ± SEM (right panel). SCA3 15Q, n = 4; SCA3 84Q, n = 5; SCA3 84Q + IGF-1, n = 5. (c) Western blot was performed to analyze the expression of mitochondrial dynamics-related proteins (right panel). Quantification of mitochondrial dynamics-related proteins (left panel). SCA3 15Q, n = 4; SCA3 84Q, n = 4; SCA3 84Q + IGF-1, n = 4. Note: * p < 0.05 indicates a significant difference.

