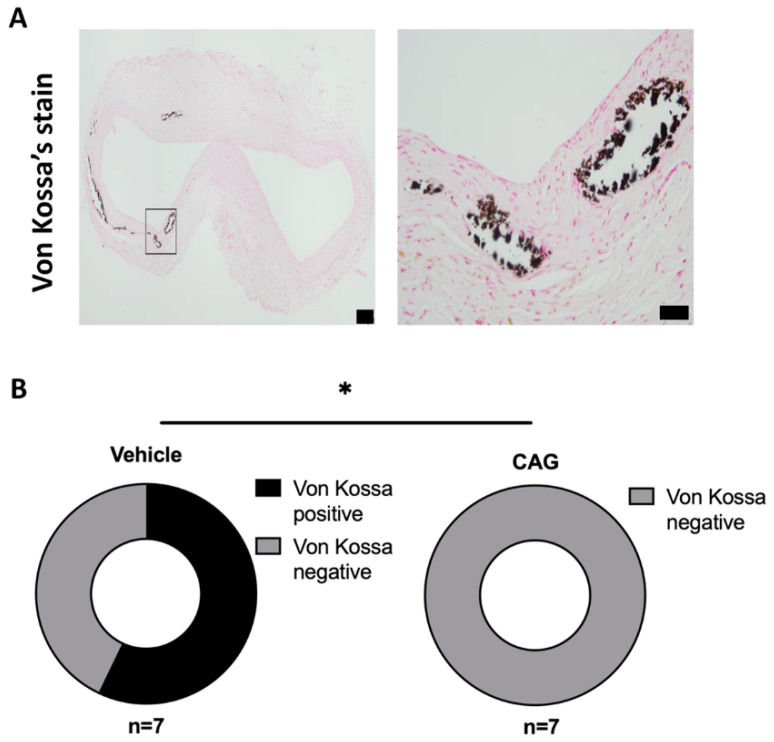
Figure 8.
The effect of CAG treatment on aneurysm calcification. (A) Representative micrographs of calcium deposits (Black) in the aneurysm wall visualized by Von Kossa’s staining (enlargement represent black square on the left image). Scale bar (black box) in micrograph to the left: 100 μm and in micrograph to the right: 50 μm. (n = 7/7). (B) Donut plot of percentage of Von Kossa’s positive aneurysm sections in CAG and vehicle treated groups (n = 7/7; p = 0.018). All values are median ± interquartile range. All RNA data is normalized to RPL41 mRNA levels. * Indicates p < 0.05.

