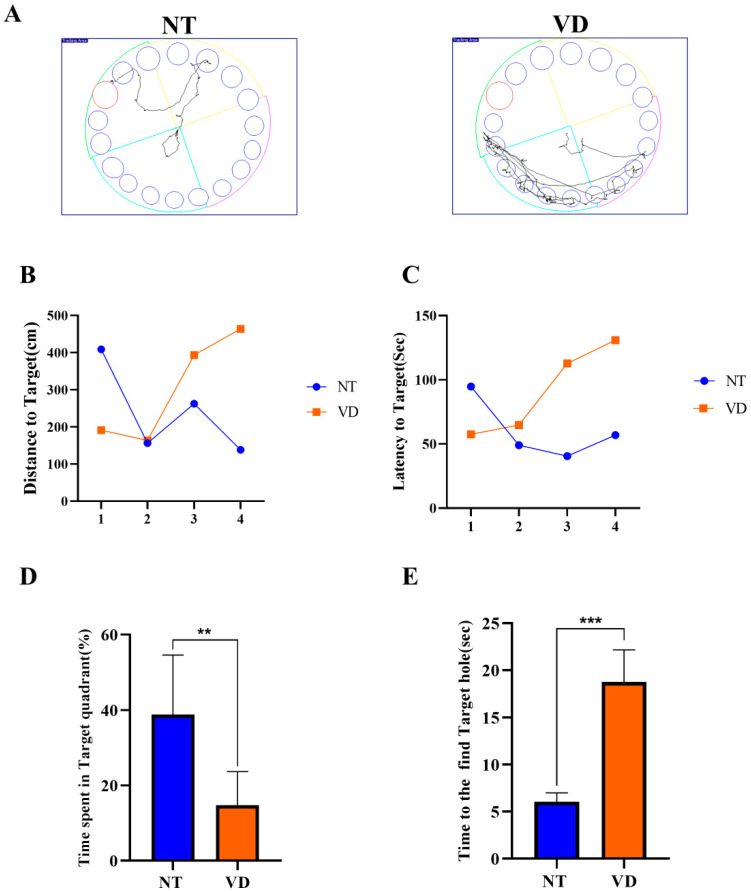
Figure 3.
Barnes-maze test (NT [normal type]: control group, VD [vascular dementia]: BCAS [bilateral carotid artery stenosis] model group). (A) Recorded experimental data. The target zone was designated via a red circle and the error zone was designated via a blue circle (left: NT, right: VD). (B) Differences between groups for the distance to the target (by day). (C) Differences between groups for latency to the target (by day). (D) Differences between groups in the percentage of time spent in the time quadrant ** p < 0.01. (E) Differences between groups in the time spent to find the target hole in the time quadrant *** p < 0.001. Data are expressed as means ± standard deviations (SD).

