Figure 1.
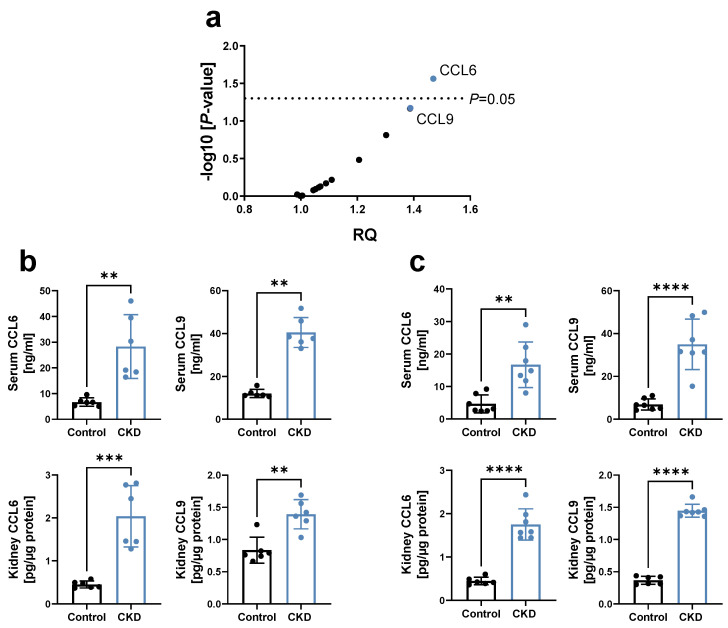
Chemokines CCL6 and CCL9 are increased in experimental CKD. (a) Chemokine profiling using a ‘Mouse Chemokine Array Kit’ in serum of 129/Sv mice 3 weeks after 5/6 Nx, relative to sham-operated controls (n = 5–7). RQ = relative quantity, with each dot representing the mean RQ of an analyzed chemokine; CCL6 and CCL9 are highlighted in blue. p via unpaired t-tests with single pooled variance. (b,c) Concentration of CCL6 and CCL9 in serum and kidney lysates of (b) C57BL/6N mice after 3 weeks of 0.2% adenine or control diet (n = 6); and (c) hyperlipidemic C57BL6/J ApoE−/− mice fed a HFD for 4 weeks, followed by 2 weeks of a 0.3%/0.15% adenine-HFD compared to HFD diet without adenine (n = 6–7). HFD = high-fat diet. (b,c) Data represent means ± SD. Unpaired two-tailed t-test or Mann–Whitney test, comparing CKD animals vs. controls. ** p < 0.01; *** p < 0.001; **** p < 0.0001.

