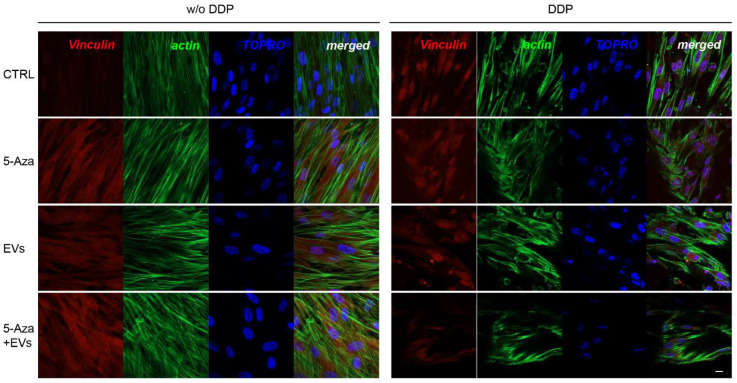
Figure 6.
Immunofluorescence analysis of Vinculin expression. Left panel shows the images of hDPSCs (CTRL), hDPSCs+5-Aza (5-Aza), hDPSCs+EVs (EVs), and hDPSCs+5-Aza+EVs (5-Aza+EVs) cultured without DDP. Right panel shows the images of hDPSCs (CTRL), hDPSCs+5-Aza (5-Aza), hDPSCs+EVs (EVs), and hDPSCs+5-Aza+EVs (5-Aza+EVs) cultured without DDP. Red fluorescence: ALP marker; green fluorescence: cytoskeleton actin; blue fluorescence: cell nuclei using TOPRO; merged image: overlap of all above mentioned channels. Representative images are shown. Scale bar: 20 µm.

