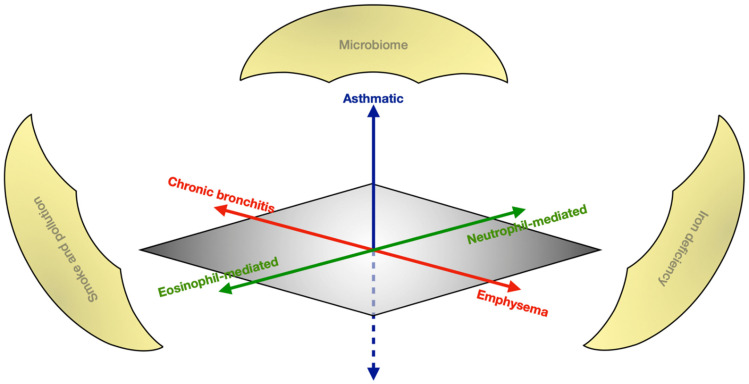
Figure 1.
The heterogeneous spectrum of COPD. The x-axis (red) demonstrates the radiological dichotomy of characterising syndromes in COPD; the y-axis (blue) represents the nosological complexity of COPD’s physiologic overlap with asthma; and the z-axis (green) shows the cellular mediation driving the disease. Overarching environmental factors (gold) perpetuate the disease.

