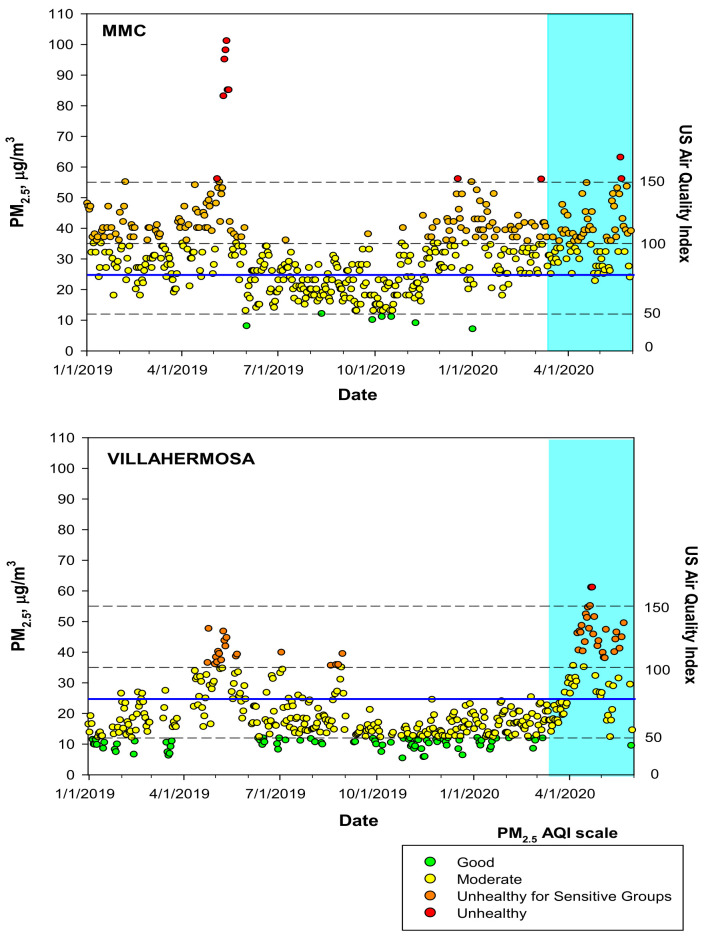
Figure 1.
Time-series of maximum PM2.5 24-h averages at MMC and estimated daily 24-h averages at MAVH January 2019 to May 2020—including the 11 m study period—classified according to the US EPA AQI index. The blue continuous line depicts the 24-h average WHO guideline. The blue shade area represents the beginning of the COVID-19 official lockdown in Mexico. Air quality data were available from the Sistema de Monitoreo Atmosférico del Gobierno de la Ciudad de México (http://www.aire.cdmx.gob.mx/default.php, accessed on 29 December 2021 and Sistema Nacional de Información de la Calidad del Aire. Instituto Nacional de Ecología y Cambio Climático (INECC), México (http://sinaica.inecc.gob.mx/data.php, accessed on 29 December 2021).

