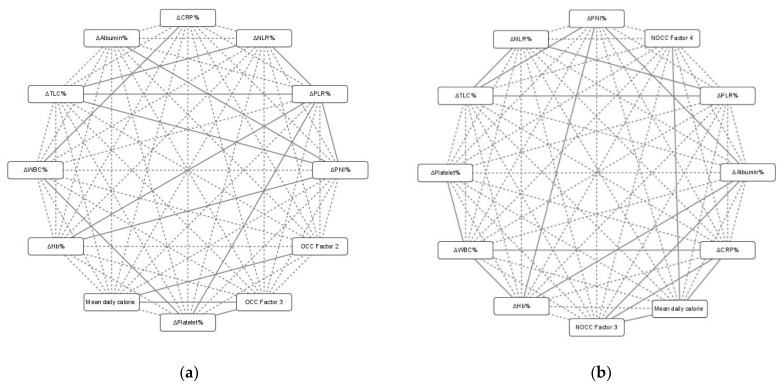
Figure 2.
(a) Patients with OCC with postoperative adjuvant CCRT; (b) patients with NOCC with primary CCRT. Two-dimensional visualization of the correlations between mean daily calorie intake (at least 25 kcal/kg/day) during the CCRT course, treatment interval changes in nutrition–inflammation biomarkers (NIBs) (ΔHb%, ΔWBC%, ΔPlatelet%, ΔAlbumin%, ΔTLC%, ΔCRP%, ΔNLR%, ΔPLR%, and ΔPNI%), and body composition (OCC Factor 2, OCC Factor 3, NOCC Factor 3, and NOCC Factor 4). OCC, oral cavity cancer; NOCC, non-oral cavity cancer; Hb, hemoglobin; WBC, white blood cell count; TLC, total lymphocyte count; CRP, C-reactive protein; NLR, neutrophil-to-lymphocyte ratio; PLR, platelet-to-lymphocyte ratio; PNI, prognostic nutritional index. Δ indicates the interval changes in the abovementioned blood NIBs before and after the CCRT course. Individual variables are represented by the nodes, and their associations are represented by the edges (connecting lines). Solid edges indicate significant associations between two variables (p < 0.05). Dashed edges indicate no correlation between two variables.

