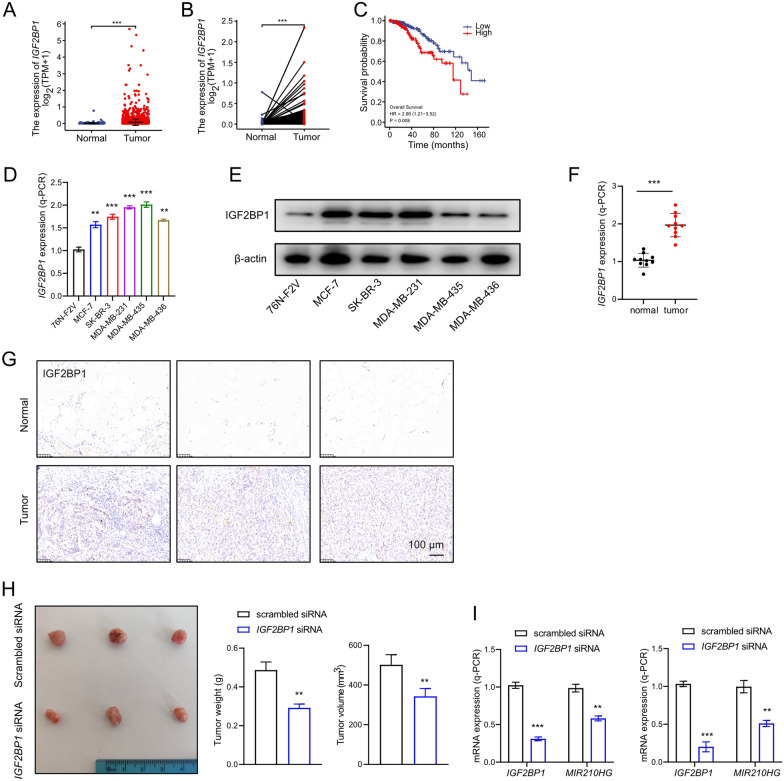
Fig. 6.
IGF2BP1 is up-regulated in breast cancer. A and B Unpaired and paired analysis of IGF2BP1 expression in TCGA-BRCA. In unpaired analysis, 1109 tumor samples and 113 normal samples were included. In paired analysis, 112 tumor samples and 112 normal samples were included. C Overall survival rate of breast cancer patients with different IGF2BP1 expression level were analyzed based on TCGA-BRCA dataset. High IGF2BP1 expression was indicated as a red line and low IGF2BP1 expression was indicated as a blue line. D and E q-PCR analysis and western blot analysis of miR-210 expression in five indicated breast cancer cell lines compared to 76 N-F2V cell. F q-PCR analysis of miR-210 expression in breast cancer tissues compared to adjacent tissues from 10 patients. G Expression of IGF2BP1 was determined by immunohistochemistry (IHC) of 6 specimens of breast cancer patients. Scar bars: 100 μm. H Xenograft tumors of 2 groups: scrambled siRNA MDA-MB-231 cell; IGF2BP1 siRNA MDA-MB-231 cell. I q-PCR analysis on MIR210HG when IGF2BP1 was silenced performed in breast cancer cells. **p < 0.01, ***p < 0.001

