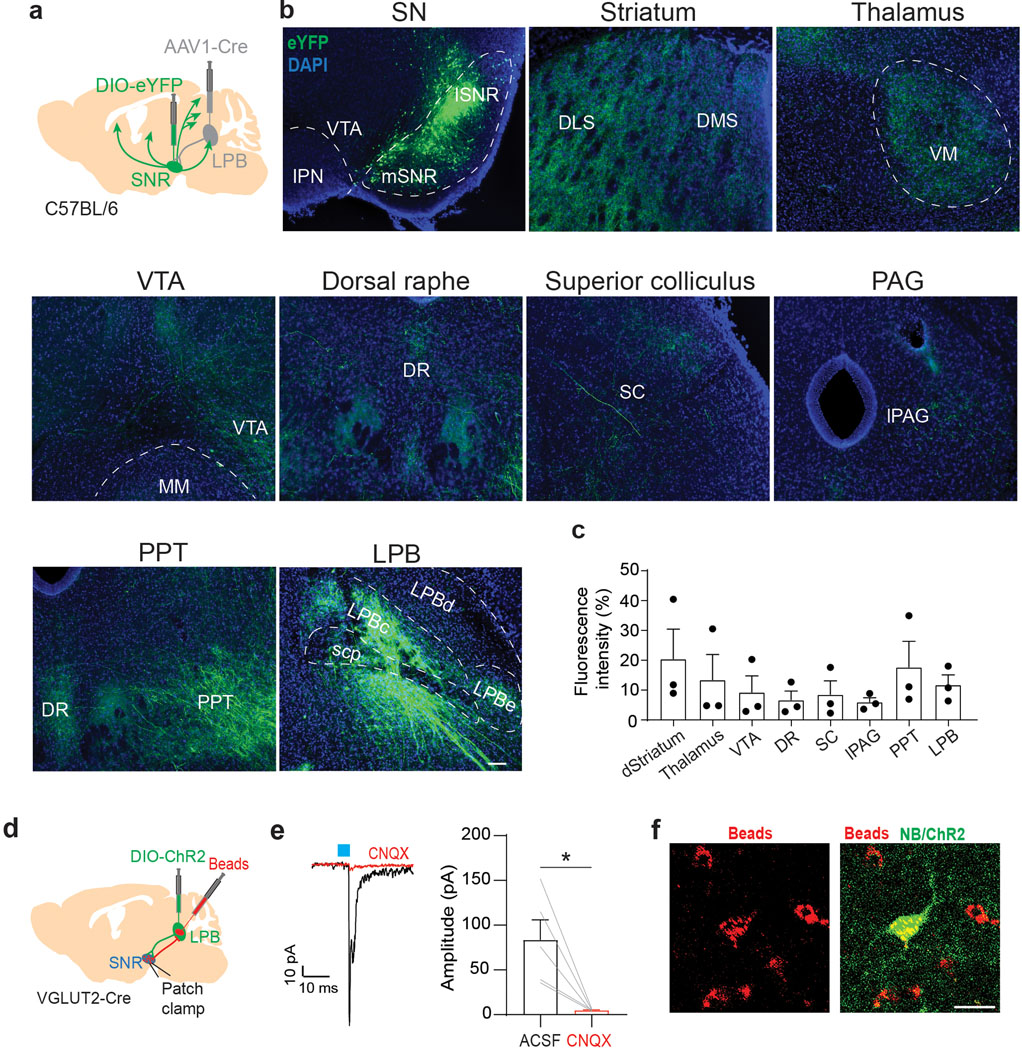
Extended Data Fig 8. Whole-brain projections of LPB-targeted SNR neurons.
(a) Schematic showing unilateral targeting of anterogradely-transported AAV1-Cre to LPB and AAV carrying Cre-dependent eYFP to SNR of C57BL/6 mice. (b) Representative fluorescent images showing coronal brain sections of eYFP-expressing cells in the SNR (upper left image) and eYFP-expressing terminals across different brain regions (scale bar 100 μm). (c) Quantification of fluorescence intensity of eYFP-expressing terminals in different brain regions (n = 3 mice). (d) Schematic showing injection of fluorescent retrobeads and AAV-DIO-ChR2 into the LPB of VGLUT2-Cre mice. Whole-cell patch-clamp recordings were performed from retrogradely-labeled (i.e., beads-positive) cells in the lateral SNR. (e) Left: Sample trace showing light-evoked EPSC from LPB-projecting SNR neurons (black trace) in response to light stimulation of LPB inputs. Light-evoked EPSCs are blocked by bath application of 20 μM CNQX (red trace). Right: Bar graph showing mean EPSC amplitudes before (ACSF) and after bath application of CNQX (n = 5 cells). (f) Sample image of retrogradely-labeled (beads, red) cells in the lateral SNR that were filled with neurobiotin (NB, green) during whole-cell patch-clamp recordings (scale bar 50 μm). Significance was calculated by means of paired t-test (e). * p < 0.05. Data represent mean ± SEM.

