Figure 1.
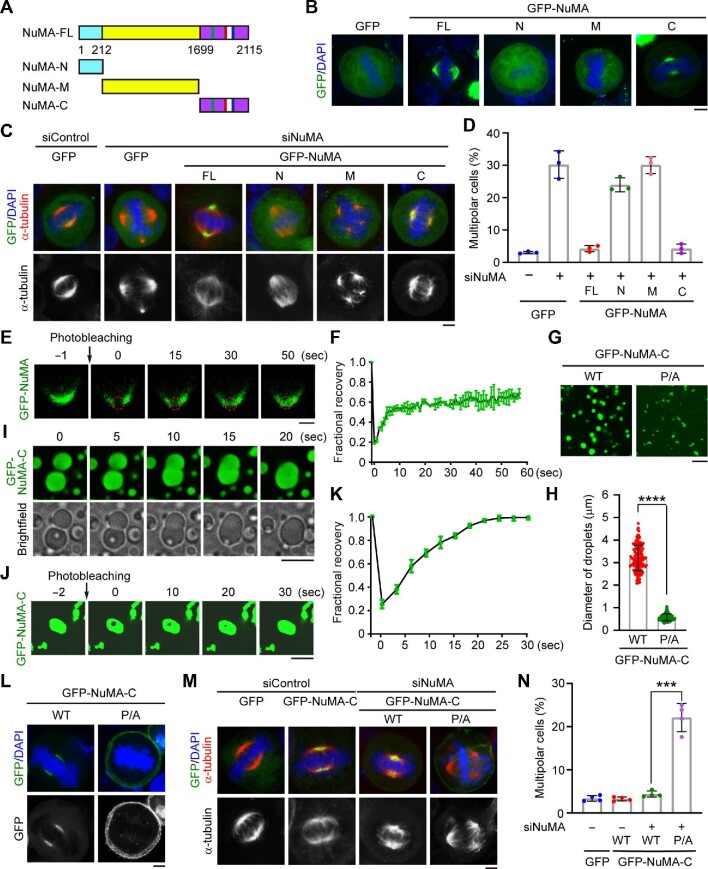
Phase separation of NuMA promotes spindle pole formation. (A) Schematic representations of full-length (FL) NuMA and truncated mutants. (B) Fluorescence images showing the localization of GFP-tagged full-length NuMA and truncated mutants in HeLa cells. Scale bar, 5 μm. (C and D) Immunofluorescence images of mitotic spindles (C) and quantification of the percentage of mitotic cells with multipolar spindles (D, n = 3 independent experiments) for HeLa cells transfected with the indicated siRNAs and plasmids. For each experiment, 60 mitotic cells were quantified. Scale bar, 5 μm. (E and F) FRAP analysis (E) and quantification (F, n = 2 independent experiments) of GFP-NuMA signals in HeLa cells. Scale bar, 2 μm. (G and H) Representative images (G) and size (H, n = 100 droplets from three independent experiments) of droplets formed by purified GFP-NuMA-C wild type (WT) or proline-to-alanine (P/A) mutant. Scale bar, 10 μm. (I) Time-lapse microscopy showing the fusion of GFP-NuMA-C droplets into a larger droplet. Scale bar, 10 μm. (J and K) FRAP analysis (J) and quantification (K, n = 3 independent experiments) of droplets formed by 10 μM purified GFP-NuMA-C. Scale bar, 5 μm. (L) Fluorescence images showing the localization of GFP-NuMA-C wild type and mutant in metaphase HeLa cells. Scale bar, 5 μm. (M and N) Immunofluorescence images of mitotic spindles (M) and quantification of the percentage of mitotic cells with multipolar spindles (N, n = 4 independent experiments) for HeLa cells transfected as indicated. For each experiment, 60 mitotic cells were quantified. Scale bar, 5 μm. Data are shown as mean ± SD. ***P < 0.001, ****P <0.0001.

