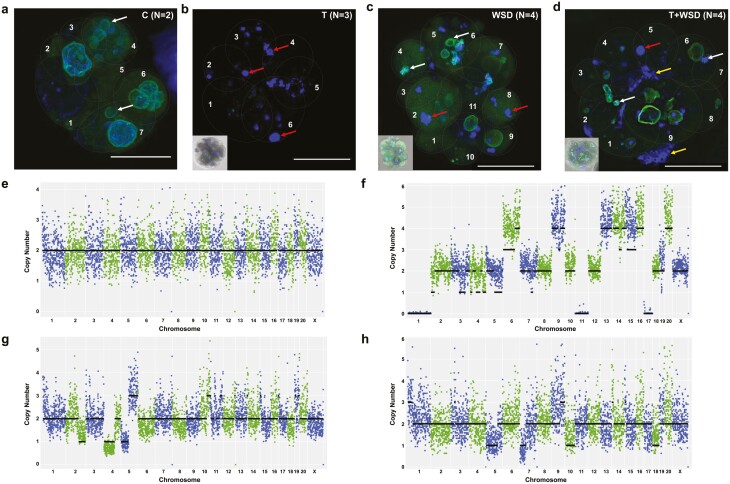
Figure 4.
Assessment of nuclear integrity and copy number variation (CNV) in cleavage stage embryos from each treatment group. Cleavage stage embryos (6-11 cells) from the 4 treatment groups were collected and immunolabeled for the nuclear envelope marker LMNB1 (green) and stained with 4′,6-diamidino-2-phenylindole for DNA detection (blue). (A) Although a few micronuclei (white arrows) were present in cleavage stage embryos from the control group (n = 2), the main nucleus of each blastomere was enclosed by nuclear envelope. (B) In contrast, cleavage stage embryos in the testosterone (T) group (n = 3) lacked well-defined primary nuclei and instead possessed highly fragmented DNA without any evidence of nuclear envelope (red arrows). Besides micronuclei and nuclear fragmentation, the (C) Western-style diet (WSD; n = 4) and (D) T + WSD (n = 4) embryos also contained chromosome-containing cellular fragments (yellow arrows), which was more prominent in the T + WSD group. To aid in the visualization of each cell, blastomeres are numbered and outlined with a gray dashed line. Scale bar = 50 µm. CNV analysis was performed on individual blastomeres from other cleavage stage embryos in each treatment group and representative chromosome plots are shown. (E) While euploid blastomeres were primarily detected in the control group (n = 40 blastomeres from 7 embryos), (F-H) almost all cells in the T (n = 21 blastomeres from 3 embryos), WSD (n = 19 blastomeres from 4 embryos), and T + WSD (n = 8 blastomeres from 2 embryos) groups were aneuploid, with chaotic aneuploidy (>4 chromosomal losses and/or gains) being the predominant source. The chromosome number is listed in order on the x-axis, and copy number is represented on the y-axis.

