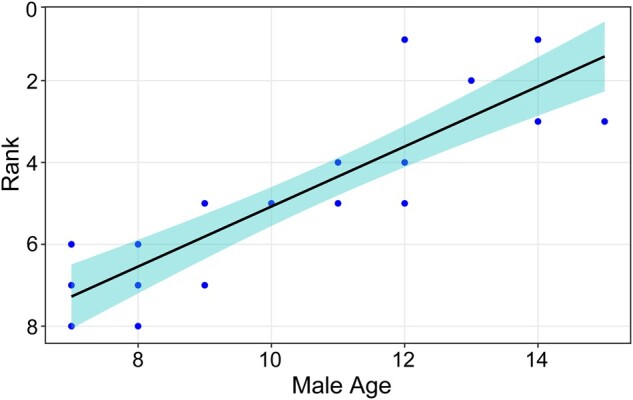
Figure 2.

Correlation of resident male age and rank. Linear model: y = −0.755x + 12.658. Rank 1 represents the highest ranking male, rank 2 is the second highest ranking male, etc. The figure is for illustrative purposes only because some males are represented in more than 1 year.
