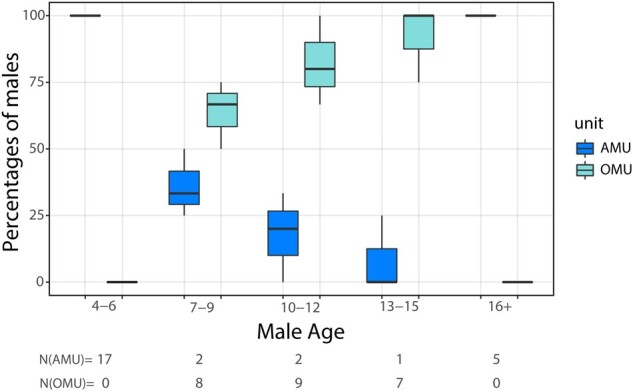
Figure 4.

Percentages of male subjects in each age class that belong to the AMU or are resident males in an OMU. Box plots show medians, IQRs, and ranges over the 3 years of the study. N(AMU) and N(OMU) are sample sizes of males in the AMU and OMUs, respectively. The figure is for illustrative purposes only, since some males were represented in more than 1 year.
