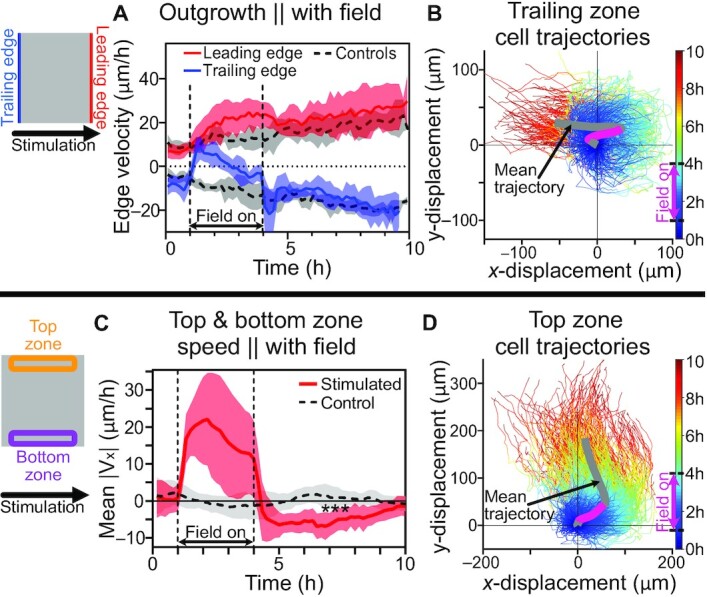
Fig. 2.

Edges parallel and perpendicular to the field direction displayed distinct behaviors. Cartoons indicate analysis zones. (A) Edge outgrowth speed (positive is rightward motion). Control edges (gray) exhibit steady outwards motion, while stimulated edges exhibit perturbed outgrowth during stimulation with rapid poststimulation recovery. (B) Cell trajectories from the trailing zone. Lines color-coded by time (see color bar). Mean trajectory of all tracked trailing zone cells indicated with bold gray line; magenta overlay indicates period of active stimulation. All trajectories were plotted as positive final y-displacements. See Movie 3. (C) Average speed in the direction of the electric field in top and bottom edge zones. Note strong increase in rightward motion in these zones during stimulation and rapid over-correction poststimulation (antiparallel motion). ***: P = 0.0002 between stimulated and control tissues over 6–10 h. (D) Cell trajectories from top edge zone. Note again recoiling motion poststimulation. For panels (A) and (C), shading indicates SD across Ncontrol = 6 and Nstimulated = 9; panels (B) and (D) represent single tissues, where zones exclude 1.5 mm on each side for edge effects.
