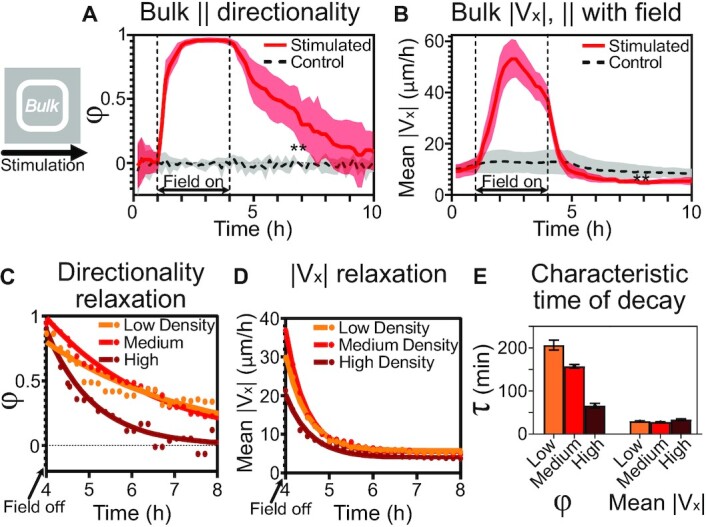
Fig. 3.

Tissue centers show migratory memory poststimulation. All data here are captured from the tissue bulk region (see cartoon). (A) Directionality order parameter φ comparison between unstimulated (dashed gray) and stimulated (red) tissues. Note sustained directionality even poststimulation. **: P = 0.003 between mean values of stimulated and control tissues over 6–10 h. (B) Average horizontal speed (parallel to field) during stimulation. Note both strong rise during stimulation and sharp fall poststimulation to below control levels. **: P = 0.003 over 6–10 h. (C) and (D) Exponential decay modeling of poststimulation relaxation dynamics τ for low, medium and high density tissues (see Methods). Raw data in (C) and (D) indicated by dots; solid curves represent best fits. (E) Quantification of characteristic timescales with respect to cell densities for directionality (left) and horizontal speed (right). Note slow directionality relaxation and inverse relation between density and directionality relaxation, which is not true for speed relaxation. For panels (A) and (B), Ncontrol = 6 and Nstimulated = 9; shading indicates SD; (C)–(E) include N= 5, 9, and 4 for low, medium, and high density tissues, respectively. In all panels, tissues’ center 2 × 2 mm were analyzed.
