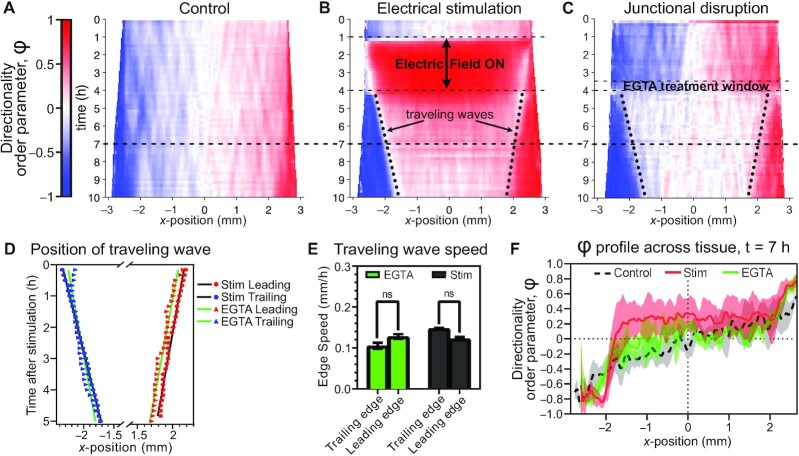
Fig. 4.
Kymographs reveal apparent mechanical reset postelectrical stimulation. (A)–(C) Averaged directionality order parameter φ kymographs (see Methods) demonstrate the evolution of x-axis motion patterns across a whole tissue. (A) Control tissues, (B) electrically stimulated tissues, and (C) tissues with EGTA-disrupted cell–cell junctions (see Methods), where the end of treatment was timed to coincide with the end of stimulation in (B) for optimal comparison. Dashes diagonal lines in (B) and (C) demarcate the ‘triangles’—inward traveling waves of outward migration induced by mechanical reset. (D) Plot of the positions of these traveling waves in (B) and (C); lines are linear best fits, see panel legend and Methods. (E) Traveling wave speeds from slopes of linear fits in (D): EGTA junction disruption (green); and electrically stimulated tissues (gray). Error bars indicate SD. (F) Profile at t = 7 h of directionality order parameter φ across all 3 kymographs, as marked by the dashed black line across panels (A)–(C). Shading indicates SD across tissues. For all panels, Ncontrol = 6, Nstimulated = 9, and NEGTA = 3.

