Fig. 5.
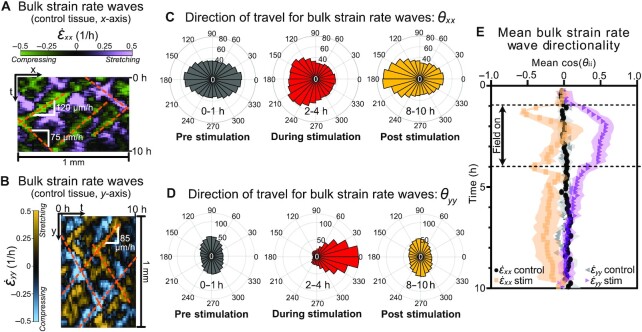
Strain waves reorient based on electrical stimulation. (A) Representative x–t kymograph (1 mm over 10 h) of bulk strain rate  in unstimulated tissues showing horizontal strain wave propagation. Positive strain rate (purple) indicates stretch; negative strain (green) indicates compression. Wave propagation speeds (slope of dashed orange lines) varied from 75 to 120 μm/h. (B) Representative y–t kymograph of bulk strain rate
  ; note vertical orientation relative to 5A to emphasize vertical strain wave propagation. (C) Polar histograms of strain rate wave direction, θxx, in stimulated tissues plotted for 3 experimental regimes: unstimulated (gray, 0–1 h); stimulated (red, 2–4 h); and poststimulation (yellow, 8–10 h). Note sustained leftward shift of θxx poststimulation. (D) Polar histograms of strain rate wave direction, θyy, analogous to 5C. Note transient rightward orientation during stimulation (red), followed by recovery to baseline poststimulation (yellow) strongly matching the unstimulated case (gray). (E) Quantification of average strain wave directionality (mean cos(θii); −1 is leftward, +1 is rightward) for each condition. Control tissue cases of
  (black) and
  (gray) show no net directionality. Orange squares show mean cos(θxx) time-course in stimulated tissues. Note perturbation during stimulation and persistent lack of recovery, biased leftward. Purple triangles show mean cos(θyy) in stimulated tissues. Note rightward perturbation during stimulation and clear recovery poststimulation. Shading indicates SD across tissues. Panels (C)–(E) data is averaged over N= 9 stimulated tissues.

