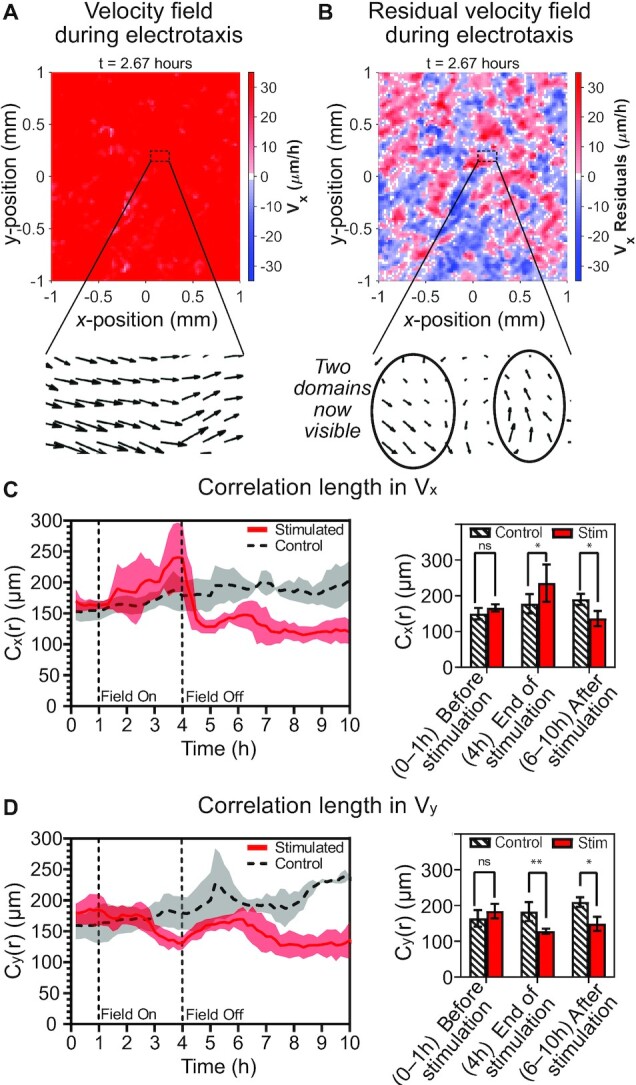
Fig. 6.

Electrical stimulation has a lasting effect on spatial correlations. (A) Velocity heatmap during electrotaxis showing the global stimulus response of the central 1 × 1 mm region of a representative tissue. Inset shows velocity vector field in a 200 × 100 μm zone. (B) Corresponding heatmap of velocity residuals during electrotaxis emphasizing many small, correlated domains. Corresponding inset to (A) showing underlying domains. (C), left Temporal dynamics of correlation length for Vx: Cx(r) showing increased correlation during stimulation and decreased correlation poststimulation. (C), right Statistical comparisons of Cx(r) relative to control (*, P = 0.04) emphasize ∼40% relative increase during stimulation and ∼40% decrease poststimulation. (D), left Temporal dynamics of correlation length for Vy: Cy(r). (D), right Statistical comparisons of Cx(r) relative to control (**, P = 0.004; *, P = 0.04). Note sustained drop in correlation relative to control by 10 h. For all correlations, shading and error bars indicate SD; Nstimulated = 9 and Ncontrol = 6.
