Abstract
Background
Airway mucus plugs in asthma are associated with exacerbation frequency, increased eosinophilia, and reduced lung function. The relationship between mucus plugs and spatially overlapping ventilation abnormalities observed at hyperpolarized gas MRI has not been assessed quantitatively.
Purpose
To assess regional associations between CT mucus plugs scored by individual bronchopulmonary segment and corresponding measurements of segmental ventilation defect percentage (VDP) at hyperpolarized helium 3 (3He) MRI.
Materials and Methods
In this secondary analysis of a Health Insurance Portability and Accountability Act–compliant prospective observational cohort, participants in the Severe Asthma Research Program (SARP) III (NCT01760915) between December 2012 and August 2015 underwent hyperpolarized 3He MRI to determine segmental VDP. Segmental mucus plugs at CT were scored by two readers, with segments scored as plugged only if both readers agreed independently. A linear mixed-effects model controlling for interpatient variability was then used to assess differences in VDP in plugged versus plug-free segments.
Results
Forty-four participants with asthma were assessed (mean age ± standard deviation, 47 years ± 15; 29 women): 19 with mild-to-moderate asthma and 25 with severe asthma. Mucus plugs were observed in 49 total bronchopulmonary segments across eight of 44 patients. Segments containing mucus plugs had a median segmental VDP of 25.9% (25th–75th percentile, 7.3%–38.3%) versus 1.4% (25th–75th percentile, 0.1%–5.2%; P < .001) in plug-free segments. Similarly, the model estimated a segmental VDP of 18.9% (95% CI: 15.7, 22.2) for mucus-plugged segments versus 5.1% (95% CI: 3.3, 7.0) for plug-free segments (P < .001). Participants with one or more mucus plugs had a median whole-lung VDP of 11.1% (25th–75th percentile, 7.1%–18.9%) versus 3.1% (25th–75th percentile, 1.1%–4.4%) in those without plugs (P < .001).
Conclusion
Airway mucus plugging at CT was associated with reduced ventilation in the same bronchopulmonary segment at hyperpolarized helium 3 MRI, suggesting that mucus plugging may be an important cause of ventilation defects in asthma.
© RSNA, 2021
Summary
Mucus plugs identified at CT in asthma were spatially correlated with regions of ventilation defect identified at hyperpolarized helium 3 MRI, suggesting sensitivity to localized, potentially treatable causes of airway obstruction.
Key Results
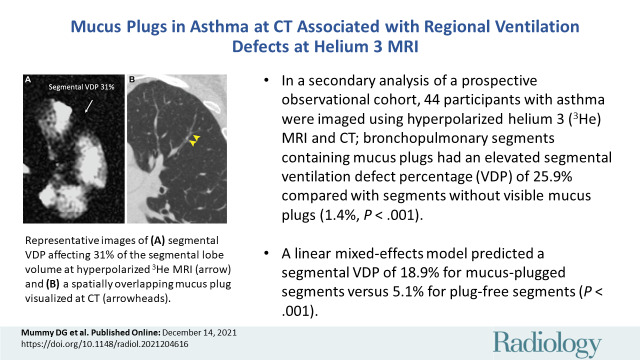
■ In a secondary analysis of a prospective observational cohort, 44 participants with asthma were imaged using hyperpolarized helium 3 (3He) MRI and CT; bronchopulmonary segments containing mucus plugs had an elevated segmental ventilation defect percentage (VDP) of 25.9% compared with segments without visible mucus plugs (1.4%; P < .001).
■ A linear mixed-effects model predicted a segmental VDP of 18.9% for mucus-plugged segments versus 5.1% for plug-free segments (P < .001).
Introduction
Ventilation heterogeneity is a ubiquitous feature of asthma (1) and is reflected in ventilation defects observed at hyperpolarized helium 3 (3He) MRI (2). These defects are associated with a history of severe exacerbation (3), prospective exacerbation frequency (4), global increase in sputum eosinophils (5), local increases in neutrophils (6), and air trapping and airway wall thickening (6,7) at CT. Pathologic changes in goblet cell hyperplasia and mucus gland hypertrophy have long been associated with inflammation and injury of the airway and with severe exacerbations in asthma (8–10); fatal status asthmaticus results from an acute loss of ventilation/gas exchange secondary to the rapid accumulation of multiple mucus plugs (11). Mucus plugs can be observed at CT and have been associated with eosinophilia and reduced lung function as measured with spirometry (12). Recent work by Svenningsen et al (13) showed that whole-lung measures of mucus plugs are associated with the whole-lung ventilation defect percent (VDP) measured at hyperpolarized 3He MRI. However, mucus and ventilation heterogeneity may be associated with parallel obstructive processes. There is a lack of studies that systematically assess bronchopulmonary segment–level spatial correlations of mucus plugging in asthma with ventilation defects at hyperpolarized gas MRI through direct spatial registration and quantitative statistical evaluation. We sought to evaluate the regional association between the presence of airway mucus plugs within a bronchopulmonary segment and corresponding measures of ventilation observed at hyperpolarized 3He MRI in the same segment. Thus, the aim of our study was to assess regional associations between CT mucus plugs scored by individual bronchopulmonary segment and corresponding measurements of segmental VDP at hyperpolarized 3He MRI.
Materials and Methods
Study Sample
Our study sample was drawn from the University of Wisconsin-Madison subset of the multisite National Heart, Lung, and Blood Institute, or NHLBI, Severe Asthma Research Program (SARP) III (SARPIII) cohort with inclusion criteria as described previously (14), all of whom were recruited and imaged between December 2012 and August 2015 (ClinicalTrials.gov identifier: NCT01760915). This secondary analysis of a prospective study was compliant with the Health Insurance Portability and Accountability Act and approved by our institutional review board. Written informed consent was obtained from all participants.
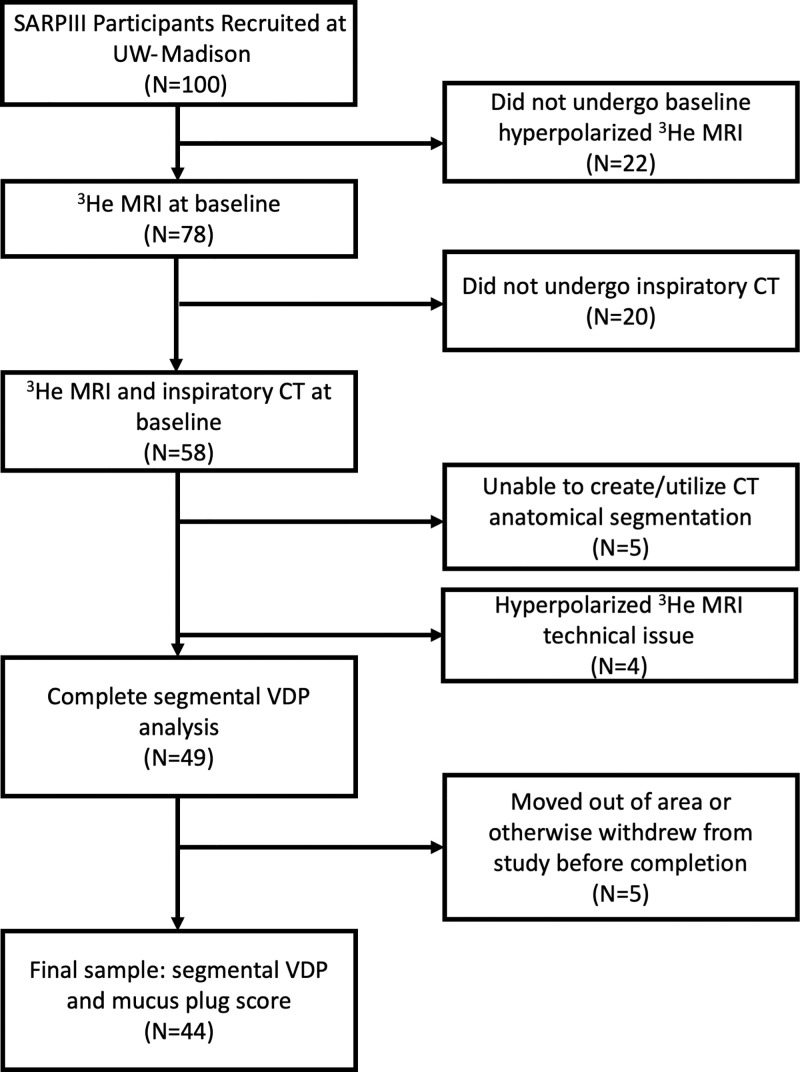
The sample was classified as having mild-to-moderate or severe asthma as defined by the SARP (ClinicalTrials.gov identifier: NCT01606826) criteria (15). Patients from the UW-Madison SARPIII cohort who were imaged using both hyperpolarized 3He MRI and inspiratory CT were eligible for inclusion in this substudy. Patients were excluded if image analysis was precluded by technical problems with CT or hyperpolarized 3He MRI, including issues with acquisition or image quality (Fig 1). A subset of these participants was scored for segmental mucus plugs at CT by a team of radiologists as part of a separate analysis that required 3-year follow-up CT. Thus, participants lost to follow-up (eg, those who moved out of the area or chose to discontinue) were not scored and were excluded from the study.
Figure 1:
Flowchart of study sample and image processing steps with number and percentage of total at each stage. All imaging was performed after administration of a bronchodilator. Segmental mucus plugs were scored by a team of radiologists as part of a larger study that required 3-year follow-up CT. Thus, patients who were lost to follow-up because they moved out of the area or otherwise withdrew from the study (n = 5) were not scored and were excluded from our final sample. SARPIII = Severe Asthma Research Program III, VDP = ventilation defect percentage.
Portions of these results were presented as abstracts at the 2016 and 2018 annual meetings of the American Thoracic Society (16,17). Overlap of the current study sample with these previous works includes 20 and seven, respectively, of the 44 total participants studied in the current work; the former were part of an analysis of lobar associations, and the latter, an analysis of the same associations but in a much smaller sample. Data generated by the authors or analyzed during the study are available from the corresponding author by request.
Global markers included spirometry results, fractional exhaled nitric oxide, and blood and sputum samples; all studies were performed on the same visit day. Blood serum analysis and measurements of fractional exhaled nitric oxide were performed as described elsewhere (15). Percentage of predicted values for forced expiratory volume in 1 second (FEV1), forced vital capacity (FVC), and FEV1/FVC ratio were generated using the Global Lung Function Initiative reference values (18).
Image Acquisition
Imaging included CT, conventional proton MRI, and hyperpolarized 3He MRI. To mitigate the effects of airway hyperresponsiveness, CT, MRI, and spirometry were performed after administration of four puffs of albuterol, a β-agonist bronchodilator. Volumetric multi–detector-row CT without contrast agent was performed at total lung capacity during a breath hold of approximately 4 seconds by using a Light Speed CT scanner (GE Healthcare) with 64 detectors (0.625 mm2 voxel size in axial plane, 0.625-mm section thickness, 0.5-mm section interval, with CT dose index volume ranging from 6.1 mGy to 11.4 mGy). Images were reconstructed using the standard kernel. Specific acquisition parameters are presented in Table E1 (online).
MRI was performed by using a 1.5-T Signa HDx scanner (GE Healthcare) with a flexible (IGC Medical Advances) or a rigid-body (Rapid Biomedical) single-channel volume coil, depending on patient size. Both coils were tuned to operate at the resonant frequency of 3He and decoupled from the body radiofrequency coil so that proton MRI and hyperpolarized 3He MRI could be performed consecutively without moving the patient. Images were acquired by using a two-dimensional multiple axial section Cartesian acquisition covering the entire lung volume (repetition time msec/echo time msec of 6.5/2.9, flip angle of 14 degrees, in-plane voxel size of 1.56 mm2, and section thickness of 15 mm). Additional parameters are summarized in Table E2 (online). Polarization of 3He gas was performed with a Heli-Spin commercial polarizer (Polarean Imaging) using the spin–exchange optical pumping method as described by Walker and Happer (19).
As noted above, CT and MRI were acquired after administration of a bronchodilator. A 4.5-mM dose of hyperpolarized 3He mixed with N2 normalized to 14% of the participant's total lung capacity was prepared in a Tedlar bag (Jensen Inert Products) purged of oxygen to slow T1 relaxation. The participant was positioned supine in the scanner and inhaled the gas dose from functional residual capacity through a short plastic tube attached to the bag. Participants were instructed to hold their breath through a 12–20-second acquisition depending on the number of sections necessary to cover the entire lung volume. Blood oxygen saturation was monitored continuously by using a pulse oximeter to ensure safety during and after the anoxic breath hold.
Image Analysis
Mucus plug scoring at CT was performed by a team of five expert thoracic radiologists (B.M.E., with 14 years of experience; J.D.N., 40 years; D.S.G., 26 years; S.K.N., 10 years; and M.L.S., 34 years) as part of a multisite effort within the SARPIII study, using the manual scoring system developed by Dunican et al (12). Two readers were randomly assigned to score each CT scan and were blinded to participant characteristics and outcomes. Each individual bronchopulmonary segment was classified as having a mucus plug only if both readers independently scored that a plug was present; otherwise, it was not scored as a plug. Registration, segmentation, and analysis of CT and MRI data were supervised by one author (D.G.M., biomedical engineering, with 7 years of experience). Chest CT images were processed through Apollo 2.0 software (VIDA Diagnostics) to generate a segmental anatomic mask identifying 19 individual bronchopulmonary segments. The hyperpolarized 3He MRI lung boundary was segmented with reference to proton MRI by using in-house software written in Matlab, version 2015 (MathWorks). The CT lung boundary mask from VIDA was deformably registered to the hyperpolarized 3He MRI boundary mask by using the ANTs software package (https://stnava.github.io/ANTs/), and the resulting transformation was applied to the original CT images and CT-derived anatomic mask, thereby registering them to the hyperpolarized 3He MRI (see image analysis workflow in Fig E1 [online]). Ventilation defects were classified at hyperpolarized 3He MRI using a previously published semiautomated algorithm (20) to calculate whole-lung VDP. The VDP by individual bronchopulmonary segment (segmental VDP) was determined by using the CT segmental mask generated by VIDA registered to the whole lung ventilation defect mask, a method based on the technique described by Thomen et al (21).
Statistical Analysis
On the basis of previously published results in the SARPIII population (12), we anticipated that mucus plugs would be identified in approximately 15% of bronchopulmonary segments. Preliminary analyses in a pilot population in our group suggested that we could expect an absolute segmental VDP difference of 10% in plugged segments versus segments without plugs. Accounting for estimated unequal variances of 10% in plugged segments versus 5% in plug-free segments, a one-sided test suggested that a minimum sample size of 158 bronchopulmonary segments (including at least 24 segments with plugs) would be necessary for 99% power to detect a significant difference. Differences in quantitative variables, including whole-lung VDP in participants with one or more mucus plugs versus those without, and in segmental VDP in segments with plugs versus those without, were assessed by using the Fisher exact test for count data and the Wilcoxon rank-sum test for continuous data. We then used an ordinary linear mixed-effects model to assess the association between a segmental mucus plug and segmental VDP while controlling for interpatient variation in overall defect burden. This same analysis was also performed with a log transform of segmental VDP (offset, 0.01) to ensure that findings were robust. Statistical analyses were performed by using R software, version 3.6.0 (https://www.r-project.org/). Statistical analyses were performed by one author (D.G.M.) and supervised and reviewed by another author (M.D.E., biostatistics, with 17 years of experience). A P value of .05 or lower was considered to indicate statistical significance.
Results
Characteristics of Study Sample
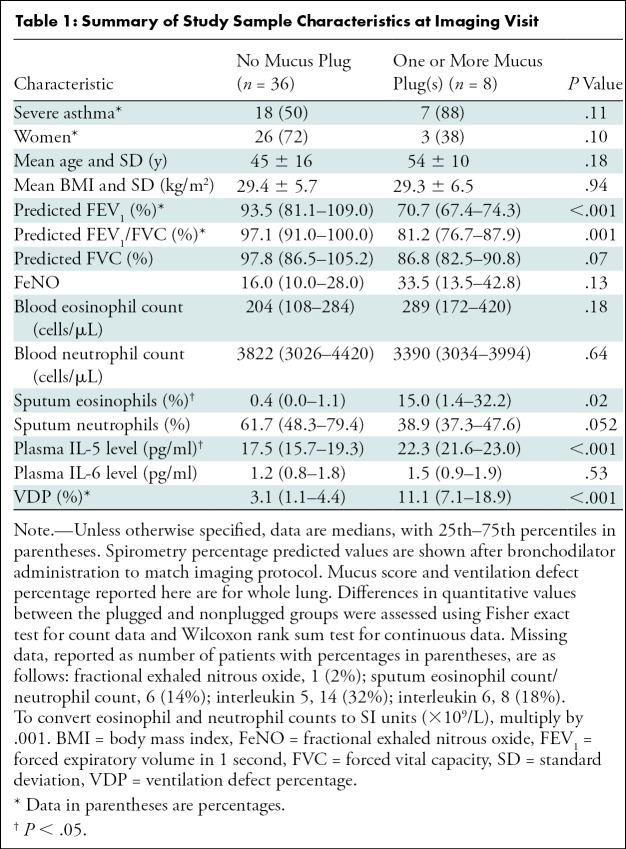
A total of 100 patients from SARPIII were recruited at UW-Madison. Among these, 58 were imaged and analyzed using both hyperpolarized 3He MRI and inspiratory CT and were thus eligible for inclusion in this substudy. Among these, five patients were excluded because of technical issues with acquisition and/or analysis of CT images, and four were excluded because of technical issues with acquisition and/or analysis of hyperpolarized 3He MRI. Among the remaining 49 patients, five moved out of the area or otherwise withdrew before study completion; thus, they were lost to follow-up and not scored at CT. This resulted in a final sample of 44 patients (Fig 1). Among the 44 individuals (mean age ± standard deviation, 47 years ± 15; 29 women) in the study sample, 19 were classified as having mild-to-moderate asthma and 25 as having severe asthma; 825 bronchopulmonary segments were evaluated, 49 (5.9%) of which were identified as having a mucus plug. Study sample characteristics are further summarized in the Table, stratified into two groups: patients with zero mucus plugs identified (n = 36) and those with one or more mucus plugs identified (n = 8). The latter group had a median of 5.5 segments with identified mucus plugs (range, 1–11 segments affected).
Table 1:
Summary of Study Sample Characteristics at Imaging Visit
Differences between Patients without Any Detectable Mucus Plugs versus at Least One Mucus Plug
Compared with patients lacking detectable mucus plugs, those with at least one mucus plug identified had reduced percentage predicted FEV1 (median [25th–75th percentile], 70.1% [67.4%–74.3%] versus 93.5% [81.1%–109.0%]; P < .001) and percentage predicted FEV1/FVC (81.2% [76.7%–82.5%] versus 97.1% [91.0%–100.0%]; P = .001), greater sputum eosinophils (15.0% [1.4%–32.2%] versus 0.4% [0.0%–1.1%]; P = .01), greater plasma interleukin 5 (22.3 pg/ml [21.6–23.0] versus 17.5 pg/ml [15.7–19.3]; P < .001), and greater whole-lung VDP (11.1% [7.1%–18.9%] versus 3.1% [1.1%–4.4%]; P < .001) (Fig E2 [online]).
Regional Correlations between Mucus Plugs and Segmental VDP
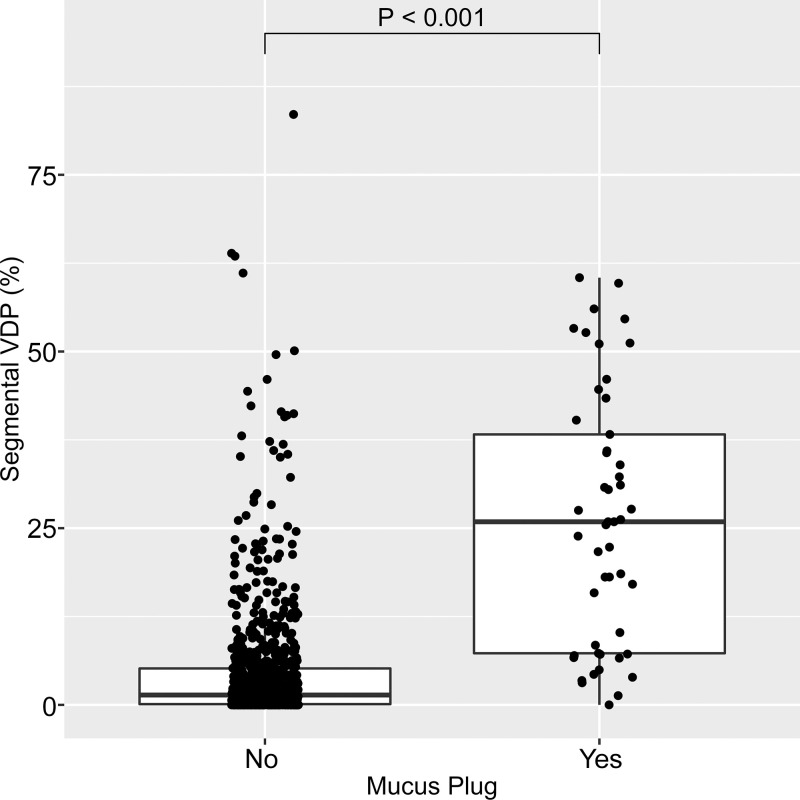
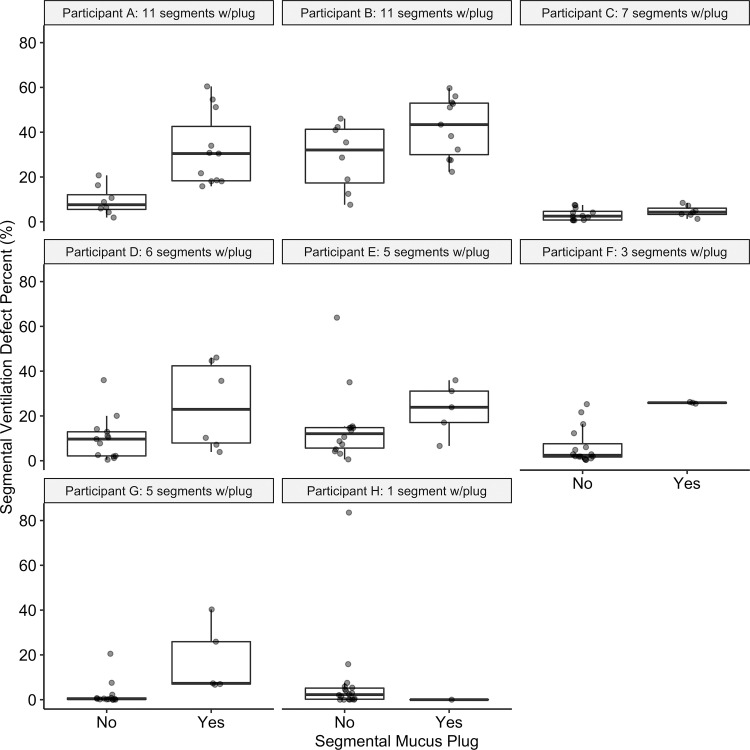
Example images of a mucus plug visualized at CT and a spatially overlapping ventilation defect at hyperpolarized 3He MRI are shown in Figure 2. Of the 825 total bronchopulmonary segments evaluated, 49 (5.9%) were identified as having a mucus plug. Segments with mucus plugs had a median segmental VDP of 25.9% (25th–75th percentile, 7.3%–38.3%) versus 1.4% (25th–75th percentile, 0.1%–5.2%) in segments without a mucus plug (P < .001), as shown in Figure 3. Figure 4 directly illustrates the intrapatient regional association of segmental VDP in mucus-plugged versus nonplugged segments for each of the eight participants in whom mucus plugs were identified. The median intrapatient segmental VDP was higher in the plugged versus unplugged segments in all but one of these participants (participant H in the figure, who had only one mucus plug identified). Finally, in the linear mixed-effects statistical model incorporating all participants in the study, and with participant identification number as a random effect to control for interpatient variation in overall defect burden, the estimated segmental VDP for a plugged segment was 18.9% (95% CI: 15.7, 22.2) versus 5.1% (95% CI: 3.3, 7.0) for an unplugged segment (P < .001). Statistical significance was unchanged when the same model was run using a log transformation of segmental VDP.
Figure 2:
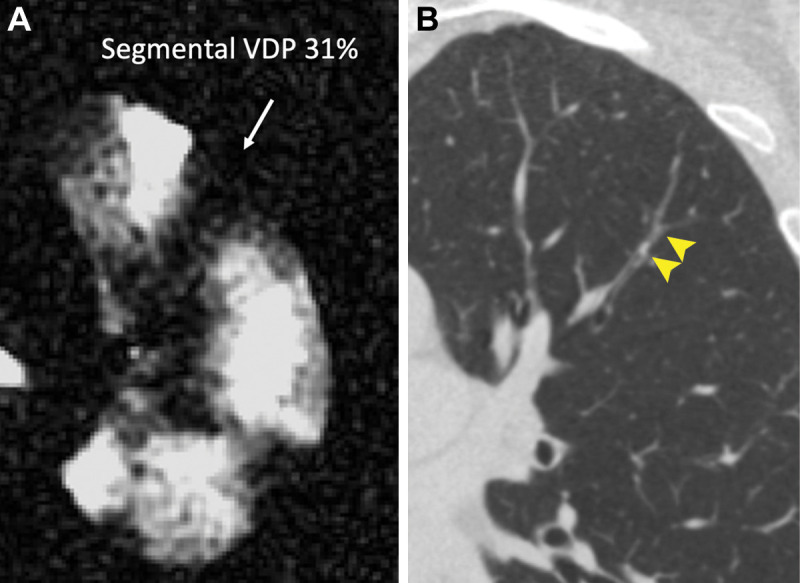
Representative images of (A) segmental ventilation defect percentage (VDP) affecting 31% of the segmental lobe volume at hyperpolarized helium 3 MRI (arrow) and (B) a spatially overlapping mucus plug visualized at CT (arrowheads).
Figure 3:
Box plot shows segmental ventilation defect percentage (VDP) in segments with no mucus plug (left) and with at least one mucus plug (right). Horizontal lines represent the median, 25th percentile, and 75th percentile values. Each dot represents one individual bronchopulmonary segment. Of the 825 total bronchopulmonary segments evaluated, 49 (5.9%) were identified as having a mucus plug. Segments with mucus plugs had a median segmental VDP of 25.9% (25th–75th percentile, 7.3%–38.3%) versus 1.4% (25th–75th percentile, 0.1%–5.2%) in segments without a mucus plug (P < .001).
Figure 4:
Plots show segmental ventilation defect percentage (VDP) in plugged versus nonplugged segments in each of the eight individual participants (participants A–H) with identified mucus plugs. Horizontal lines represent the median, 25th percentile, and 75th percentile values. Each dot represents one individual bronchopulmonary segment. The number of plugs identified in each participant ranged from 1 to 11, as indicated in each subplot title, with a median value of 5.5 plugged segments. Median segmental VDP in plugged segments was higher than that in the unplugged segments in all but one participant (participant H, with only one mucus plug identified). In specific participants, there is considerable overlap in values for plugged versus unplugged segments, as in participant B, for whom nearly all segments have substantial segmental VDP, and in participant C, for whom all segments have relatively low segmental VDP.
Discussion
Although mucus plugs in asthma have been associated with exacerbation frequency, increased eosinophilia, and reduced lung function, their relationship with spatially overlapping ventilation defects observed at hyperpolarized helium 3 (3He) MRI has not been assessed quantitatively. Here, we measured associations between mucus plugs scored by individual bronchopulmonary segment at CT and spatially corresponding measurements of segmental ventilation defect percentage (VDP) at hyperpolarized 3He MRI. In our study sample (n = 44), segments containing mucus plugs had a segmental VDP of 25.9% versus 1.4% in segments with patent airways (P < .001). Similarly, a linear mixed-effects model controlling for interpatient variability predicted a segmental VDP of 18.9% for mucus plugged segments versus 5.1% for plug-free segments (P < .001).
Mucus hypersecretion is common in asthma (8), particularly in severe fatal asthma (10,22,23), and mucociliary clearance is reduced even in patients with symptom-free asthma (24). Svenningsen et al (13) compared airway mucus plugs and corresponding ventilation defects qualitatively and further established a whole-lung correlation between measures of CT mucus score and VDP at hyperpolarized 3He MRI in a sample enriched in the type 2 asthma phenotype. It is encouraging that our findings are confirmatory in a broader asthma sample. Moreover, we advance these global associations by demonstrating that ventilation defects are spatially colocalized with mucus plugs, further suggesting that mucus plugs may be directly driving increases in VDP. In addition, patterns of higher type 2 inflammation, indicated by elevated sputum eosinophil counts and plasma interleukin 5 levels, were associated with the presence of at least one mucus plug, consistent with previous findings in the larger SARPIII cohort (12).
CT and MRI were performed after administration of a bronchodilator to minimize the effect of airway narrowing from hyperresponsiveness on quantitative measures; this is a known source of obstruction visualized at hyperpolarized 3He MRI that is distinct from mucus plugging, as suggested by Svenningsen et al (7). We observed ventilation defects that were not associated with visible mucus plugs, suggesting the possibility of distal mucus plugging or small airways disease beyond the resolution of CT. Conversely, we also observed mucus plugs in the absence of prominent ventilation defects, suggesting that these airways might be only partially occluded. Incorporating more refined measures of ventilation, or observing filling temporally using dynamic imaging techniques, could further explain these discordant patterns.
Segmental VDP measured at hyperpolarized 3He MRI in asthma has been used to target bronchial thermoplasty to specific regions of ventilation defect (25). Our study suggests the possibility of a similar role in the development of mucolytic drugs delivered through targeted bronchoscopy in patients in whom systemic therapy is contraindicated or ineffective. Furthermore, several recent studies (26,27) used segmental VDP in modeling inhaled aerosol distribution in patients with asthma who have fixed airway obstruction. When combined with mucus-related ventilation patterns, these techniques could provide a guide to improving inhaled therapies or to direct mucolytics or other aerosols to the lung periphery for more effective treatment.
With a diverse range of targeted (but costly) asthma drugs rapidly entering mainstream clinical use, there is a growing need for techniques to personalize therapies and to monitor and evaluate treatment response. Imaging techniques for evaluating localized airway obstruction specifically related to mucus plugs could aid in developing and testing targeted therapies and evaluating individual therapy response, particularly in severe cases where the high cost of therapy and/or a severe clinical outcome could justify the cost of advanced imaging examinations. One way to operationalize these methods would be to use the proportion of ventilation defect associated with airway mucus plugs, or the mucus-associated ventilation burden, as an image marker to evaluate the functional importance of mucus plugging and therapy response. Similarly, our method could be expanded to use ventilation heterogeneity as a basis for investigating the functional importance of a suite of possible mechanisms of airway obstruction and prediction of reversibility of obstruction (28,29) on a segmental basis, including air trapping and functional small-airways disease (6,30), airway wall thickness (7), smooth muscle hyperresponsiveness (31,32), and localized (ie, voxel-based) measures of ventilation heterogeneity (33).
Our study had limitations. First, the number of patients with visible mucus plugs was small (n = 8). Second, this method of CT mucus scoring did not discriminate mucus extent beyond a binary indicator for each bronchopulmonary segment. Finally, radiation dose concerns in the study protocol precluded the acquisition of CT scans before bronchodilator administration, which, coupled with the corresponding hyperpolarized 3He MRI, would provide further functional insights regarding the effect of bronchodilation on mucus plugs and their functional correlates.
In conclusion, this study showed that mucus plugs identified within individual bronchopulmonary segments at CT are associated with greater ventilation defect burden in that same segment, suggesting a causal relationship between airway mucus and ventilation defects in asthma. Future efforts to develop an automated scoring algorithm could help to refine, streamline, and standardize the counting process. Furthermore, this type of imaging-based analysis framework could form the basis for future studies using hyperpolarized helium 3 MRI to evaluate mechanisms of ventilation heterogeneity in obstructive lung disease together with localized functional response to targeted therapeutic agents.
Supported by the Severe Asthma Research Program (SARP), National Institutes of Health (NIH)/National Heart, Lung, and Blood Institute (NHLBI) (R01 HL080412, U10 HL109168), NIH/National Center for Advancing Translational Sciences (NCATS) (S10 OD016394), and Wisconsin Alumni Research Foundation (WARF) Technology Transfer Research Assistantship.
S.B.F. supported by GE Healthcare and NIH.
Disclosures of conflicts of interest: D.G.M. Scientific consultant for Polarean Imaging. E.M.D. No relevant relationships. K.J.C. Was consultant for Imbio; employed by Imbio. M.D.E. No relevant relationships. B.M.E. No relevant relationships. J.D.N. Consultant and medical advisor for VIDA; employed by VIDA and National Institutes of Health (NIH); grants/grants pending with NIH; payment for lectures including service on speakers bureaus, payment for development of educational presentations, and travel/accommodations/meeting expenses unrelated to activities listed from VIDA; patents (planned, pending, or issued) with and stock/stock options in VIDA; payment for manuscript preparation and royalties from Elsevier. D.S.G. No relevant relationships. S.K.N. Patent with Wisconsin Alumni Research Foundation. M.L.S. Patent with John Fahy, UCSF; Deputy Editor of Radiology. R.L.S. No relevant relationships. N.N.J. Institution supported by grant from AstraZeneca; consultant for Pulmocide and GlaxoSmithKline. L.C.D. Consultant for AstraZeneca, Sanofi. J.V.F. Consulting fee or honorarium from Gossamer, Arrowhead, Ionis Pharmaceuticals, and Connect Biopharma. S.B.F. Consultant for Sanofi/Regeneron, Polarean, Caladrius; payment for lectures including service on speakers bureaus for Sanofi/Regeneron.
Abbreviations:
- FEV1
- forced expiratory volume in 1 second
- FVC
- forced vital capacity
- SARP
- Severe Asthma Research Program
- VDP
- ventilation defect percentage
References
- 1. Downie SR , Salome CM , Verbanck S , Thompson B , Berend N , King GG . Ventilation heterogeneity is a major determinant of airway hyperresponsiveness in asthma, independent of airway inflammation . Thorax 2007. ; 62 ( 8 ): 684 – 689 . [DOI] [PMC free article] [PubMed] [Google Scholar]
- 2. Teague WG , Tustison NJ , Altes TA . Ventilation heterogeneity in asthma . J Asthma 2014. ; 51 ( 7 ): 677 – 684 . [DOI] [PubMed] [Google Scholar]
- 3. Mummy DG , Kruger SJ , Zha W , et al . Ventilation defect percent in helium-3 magnetic resonance imaging as a biomarker of severe outcomes in asthma . J Allergy Clin Immunol 2018. ; 141 ( 3 ): 1140 – 1141.e4 . [DOI] [PMC free article] [PubMed] [Google Scholar]
- 4. Mummy DG , Carey KJ , Evans MD , et al . Ventilation defects on hyperpolarized helium-3 MRI in asthma are predictive of 2-year exacerbation frequency . J Allergy Clin Immunol 2020. ; 146 ( 4 ): 831 – 839.e6 . [DOI] [PMC free article] [PubMed] [Google Scholar]
- 5. Svenningsen S , Eddy RL , Lim HF , Cox PG , Nair P , Parraga G . Sputum eosinophilia and magnetic resonance imaging ventilation heterogeneity in severe asthma . Am J Respir Crit Care Med 2018. ; 197 ( 7 ): 876 – 884 . [DOI] [PubMed] [Google Scholar]
- 6. Fain SB , Gonzalez-Fernandez G , Peterson ET , et al . Evaluation of structure-function relationships in asthma using multidetector CT and hyperpolarized He-3 MRI . Acad Radiol 2008. ; 15 ( 6 ): 753 – 762 . [DOI] [PMC free article] [PubMed] [Google Scholar]
- 7. Svenningsen S , Kirby M , Starr D , et al . What are ventilation defects in asthma? Thorax 2014. ; 69 ( 1 ): 63 – 71 . [DOI] [PubMed] [Google Scholar]
- 8. Carroll NG , Mutavdzic S , James AL . Increased mast cells and neutrophils in submucosal mucous glands and mucus plugging in patients with asthma . Thorax 2002. ; 57 ( 8 ): 677 – 682 . [DOI] [PMC free article] [PubMed] [Google Scholar]
- 9. Rogers DF . Airway mucus hypersecretion in asthma: an undervalued pathology? Curr Opin Pharmacol 2004. ; 4 ( 3 ): 241 – 250 . [DOI] [PubMed] [Google Scholar]
- 10. Aikawa T , Shimura S , Sasaki H , Ebina M , Takishima T . Marked goblet cell hyperplasia with mucus accumulation in the airways of patients who died of severe acute asthma attack . Chest 1992. ; 101 ( 4 ): 916 – 921 . [DOI] [PubMed] [Google Scholar]
- 11. Dunican EM , Watchorn DC , Fahy JV . Autopsy and imaging studies of mucus in asthma. Lessons learned about disease mechanisms and the role of mucus in airflow obstruction . Ann Am Thorac Soc 2018. ; 15 ( Suppl 3 ): S184 – S191 . [DOI] [PMC free article] [PubMed] [Google Scholar]
- 12. Dunican EM , Elicker BM , Gierada DS , et al . Mucus plugs in patients with asthma linked to eosinophilia and airflow obstruction . J Clin Invest 2018. ; 128 ( 3 ): 997 – 1009 . [DOI] [PMC free article] [PubMed] [Google Scholar]
- 13. Svenningsen S , Haider E , Boylan C , et al . CT and functional MRI to evaluate airway mucus in severe asthma . Chest 2019. ; 155 ( 6 ): 1178 – 1189 . [DOI] [PubMed] [Google Scholar]
- 14. Teague WG , Phillips BR , Fahy JV , et al . Baseline features of the severe asthma research program (SARP III) cohort: differences with age . J Allergy Clin Immunol Pract 2018. ; 6 ( 2 ): 545 – 554.e4 . [DOI] [PMC free article] [PubMed] [Google Scholar]
- 15. Moore WC , Bleecker ER , Curran-Everett D , et al . Characterization of the severe asthma phenotype by the national heart, lung, and blood institute’s severe asthma research program . J Allergy Clin Immunol 2007. ; 119 ( 2 ): 405 – 413 . [DOI] [PMC free article] [PubMed] [Google Scholar]
- 16. Dunican E , Fahy JV , Mummy DG , et al . Regional ventilation defects measured on hyperpolarized 3He MRI are associated with mucus plugging measured on CT in asthma. A19 Get Polariz MR IMAGING Obstr LUNG Dis . American Thoracic Society , 2016. ; A1052 . https://www.atsjournals.org/doi/abs/10.1164/ajrccm-conference.2016.193.1_MeetingAbstracts.A1052 . [Google Scholar]
- 17. Mummy D , Dunican E , Lampkins T , et al . Ventilation defects in asthma on hyperpolarized gas MRI are associated with airway mucus plugs on CT. D28 Respir Dis DIAGNOSIS Pulm Funct Test IMAGING . American Thoracic Society , 2018. ; A6376 . https://www.atsjournals.org/doi/abs/10.1164/ajrccm-conference.2018.197.1_MeetingAbstracts.A6376 . [Google Scholar]
- 18. Quanjer PH , Stanojevic S , Cole TJ , et al . Multi-ethnic reference values for spirometry for the 3-95-yr age range: the global lung function 2012 equations . Eur Respir J 2012. ; 40 ( 6 ): 1324 – 1343 . [DOI] [PMC free article] [PubMed] [Google Scholar]
- 19. Walker TG , Happer W . Spin-exchange optical pumping of noble-gas nuclei . Rev Mod Phys 1997. ; 69 ( 2 ): 629 . [Google Scholar]
- 20. Zha W , Kruger SJ , Cadman RV , et al . Regional heterogeneity of lobar ventilation in asthma using hyperpolarized helium-3 MRI . Acad Radiol 2018. ; 25 ( 2 ): 169 – 178 . [DOI] [PMC free article] [PubMed] [Google Scholar]
- 21. Thomen RP , Sheshadri A , Quirk JD , et al . Regional ventilation changes in severe asthma after bronchial thermoplasty with (3)He MR imaging and CT . Radiology 2015. ; 274 ( 1 ): 250 – 259 . [DOI] [PMC free article] [PubMed] [Google Scholar]
- 22. Carroll N , Carello S , Cooke C , James A . Airway structure and inflammatory cells in fatal attacks of asthma . Eur Respir J 1996. ; 9 ( 4 ): 709 – 715 . [DOI] [PubMed] [Google Scholar]
- 23. Dunnill MS . The pathology of asthma, with special reference to changes in the bronchial mucosa . J Clin Pathol 1960. ; 13 ( 1 ): 27 – 33 . [DOI] [PMC free article] [PubMed] [Google Scholar]
- 24. Pavia D , Bateman JR , Sheahan NF , Agnew JE , Clarke SW . Tracheobronchial mucociliary clearance in asthma: impairment during remission . Thorax 1985. ; 40 ( 3 ): 171 – 175 . [DOI] [PMC free article] [PubMed] [Google Scholar]
- 25. Hall CS , Quirk JD , Goss CW , et al . Single-session bronchial thermoplasty guided by 129Xe magnetic resonance imaging. A pilot randomized controlled clinical trial . Am J Respir Crit Care Med 2020. ; 202 ( 4 ): 524 – 534 . [DOI] [PMC free article] [PubMed] [Google Scholar]
- 26. Oakes JM , Mummy D , Poorbahrami K , Zha W , Fain SB . Patient-specific computational simulations of hyperpolarized 3He MRI ventilation defects in healthy and asthmatic subjects . IEEE Trans Biomed Eng 2018. ; 66 . [DOI] [PubMed] [Google Scholar]
- 27. Poorbahrami K , Mummy DG , Fain SB , Oakes JM . Patient-specific modeling of aerosol delivery in healthy and asthmatic adults . J Appl Physiol (1985) 2019. ; 127 ( 6 ): 1720 – 1732 . [DOI] [PMC free article] [PubMed] [Google Scholar]
- 28. Eddy RL , Svenningsen S , Licskai C , McCormack DG , Parraga G . Hyperpolarized hHelium 3 MRI in mild-to-moderate asthma: prediction of postbronchodilator reversibility . Radiology 2019. ; 293 ( 1 ): 212 – 220 . [DOI] [PubMed] [Google Scholar]
- 29. Stojanovska J . Insights on asthma by using hyperpolarized helium 3 MRI . Radiology 2019. ; 293 ( 1 ): 221 – 222 . [DOI] [PubMed] [Google Scholar]
- 30. Galbán CJ , Han MK , Boes JL , et al . Computed tomography-based biomarker provides unique signature for diagnosis of COPD phenotypes and disease progression . Nat Med 2012. ; 18 ( 11 ): 1711 – 1715 . [DOI] [PMC free article] [PubMed] [Google Scholar]
- 31. Svenningsen S , Kirby M , Starr D , et al . Hyperpolarized (3) He and (129) Xe MRI: differences in asthma before bronchodilation . J Magn Reson Imaging 2013. ; 38 ( 6 ): 1521 – 1530 . [DOI] [PubMed] [Google Scholar]
- 32. Costella S , Kirby M , Maksym GN , McCormack DG , Paterson NAM , Parraga G . Regional pulmonary response to a methacholine challenge using hyperpolarized (3)He magnetic resonance imaging . Respirology 2012. ; 17 ( 8 ): 1237 – 1246 . [DOI] [PubMed] [Google Scholar]
- 33. Tzeng YS , Lutchen K , Albert M . The difference in ventilation heterogeneity between asthmatic and healthy subjects quantified using hyperpolarized 3He MRI . J Appl Physiol (1985) 2009. ; 106 ( 3 ): 813 – 822 . [DOI] [PubMed] [Google Scholar]


