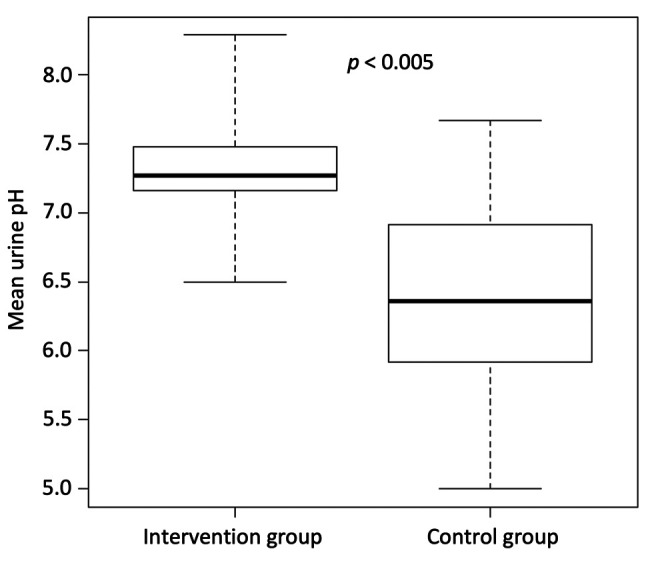
Figure 2. Urine pH in patients of the intervention and the control groups for the study period. The mean urine pH of the intervention group (n=12) and the control group (n=12) are shown. The lines indicate the median values, the error bars indicate the maximum and minimum values, and the boxes indicate the values between the upper and the lower quartiles.