. 2022 Jan 11;303(1):215–225. doi: 10.1148/radiol.211028

Figure 2:

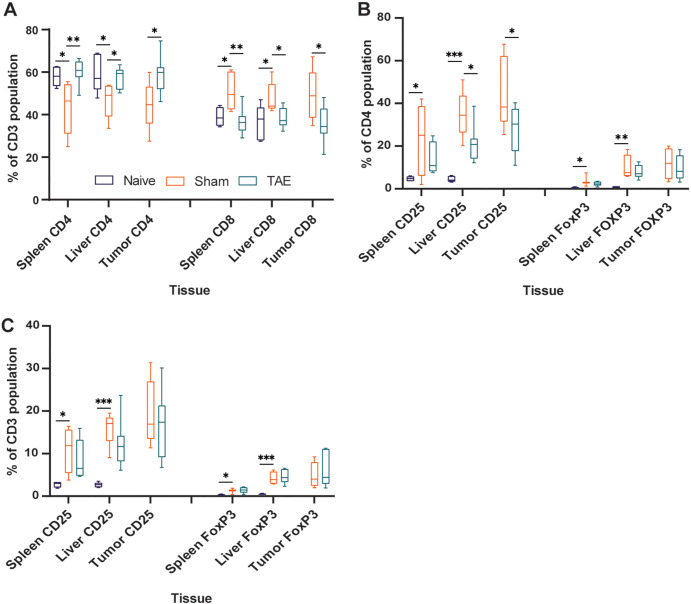
Cirrhosis and transarterial embolization (TAE) modulate lymphocyte populations. Box and whisker plots show (A) the percentage of CD4+ and CD8+ cells as a proportion of the CD3+ population in spleen, liver, and tumor specimens from healthy diethylnitrosamine-naive rats that underwent sham embolization (naive, n = 5), cirrhotic diethylnitrosamine-treated rats that underwent sham embolization (sham, n = 5), and cirrhotic diethylnitrosamine-treated rats that underwent embolization with tris-acryl gelatin microspheres (TAE group, n = 8); (B) the percentage of CD25+ and FOXP3+ cells as a proportion of the CD4+ population; and (C) the percentage of CD25+ and FOXP3+ cells as a proportion of the CD3+ population. Whiskers indicate maximum and minimum values. Boxes extend from the 25th to 75th percentiles. The line in the middle of the box is plotted at the median. * = P < .05, ** = P < .01, and *** = P < .001 according to the t test. Significant P values (left to right): in A, .04, .006, .049, .01, .02, .03, .005, .047, .02, .03; in B, .04, <.001, .03, .04, .049, <.01; and in C, .048, <.001, .03, .001.

Cirrhosis and transarterial embolization (TAE) modulate lymphocyte populations. Box and whisker plots show (A) the percentage of CD4+ and CD8+ cells as a proportion of the CD3+ population in spleen, liver, and tumor specimens from healthy diethylnitrosamine-naive rats that underwent sham embolization (naive, n = 5), cirrhotic diethylnitrosamine-treated rats that underwent sham embolization (sham, n = 5), and cirrhotic diethylnitrosamine-treated rats that underwent embolization with tris-acryl gelatin microspheres (TAE group, n = 8); (B) the percentage of CD25+ and FOXP3+ cells as a proportion of the CD4+ population; and (C) the percentage of CD25+ and FOXP3+ cells as a proportion of the CD3+ population. Whiskers indicate maximum and minimum values. Boxes extend from the 25th to 75th percentiles. The line in the middle of the box is plotted at the median. * = P < .05, ** = P < .01, and *** = P < .001 according to the t test. Significant P values (left to right): in A, .04, .006, .049, .01, .02, .03, .005, .047, .02, .03; in B, .04, <.001, .03, .04, .049, <.01; and in C, .048, <.001, .03, .001.