. 2021 Nov 3;1(5):435–441. doi: 10.21873/cdp.10058

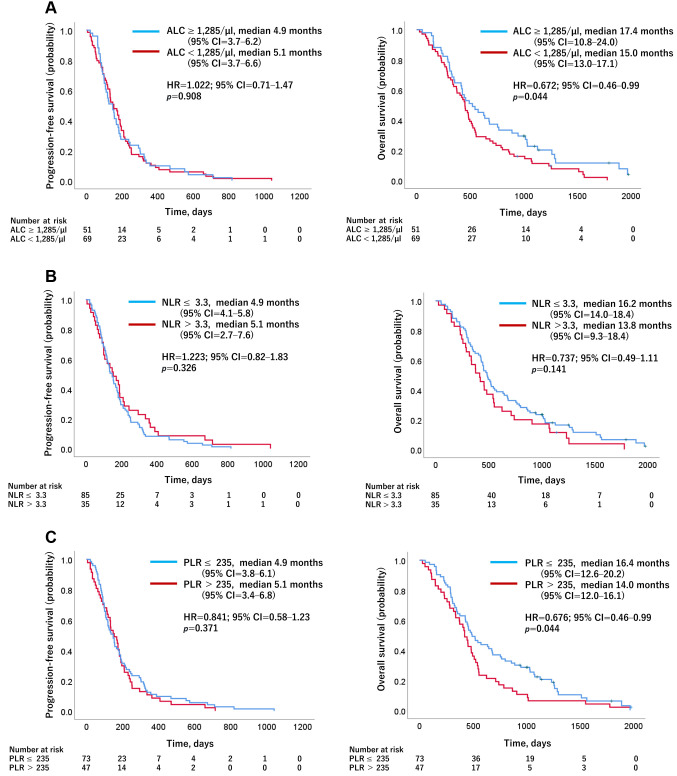
Figure 1. Kaplan–Meier curves for progression-free survival and overall survival predicted by the biomarkers. Stratification according to (A) absolute lymphocyte counts [ALC: a; ALC≥1,285/μl vs. ALC<1,285/μl (n=51 vs. 69)], (B) neutrophil-to-lymphocyte ratio [NLR: b; NLR≤3.3 vs. NLR>3.3 (n=85 vs. 35)], and (C) platelet-to-lymphocyte ratio [PLR: c; PLR≤235 vs. PLR>235 (n=73 vs. 47)]. No significant difference was found in peripheral blood biomarkers for progression-free survival (PFS). However, patients with ALC≥1,285/μl and PLR≤235 had significantly better overall survival (OS) than those with ALC<1,285/μl and PLR>235. HR: Hazard ratio; 95%CI: 95% confidence interval; ALC: absolute lymphocyte counts; NLR: neutrophil-to-lymphocyte ratio; PLR: platelet-to-lymphocyte ratio.

Figure 1