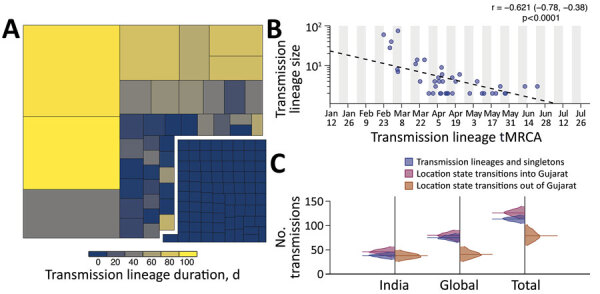
Figure 2.

Size, duration, and importation of severe acute respiratory syndrome coronavirus 2 transmission lineages, Gujarat, India. A) Tree map summarizing the 113 detected transmission lineages by size. Colors indicate the duration of persistence of the lineage, and areas indicate the size of the transmission lineages. Lineage duration corresponds to time between the lineage’s oldest and most recently sampled genomes. B) Strong log‒linear relationship between size and mean tMRCA of each transmission lineages. Gray shading indicates time of testing; dashed line indicates slope. C) Breakdown of virus importations into Gujarat from other states in India or other countries. The number of location state transitions were estimated by using a robust counting approach (21) and a 3-location discrete trait phylogeographic analysis. tMRCA, time to most recent common ancestor.
