
Figure 3.
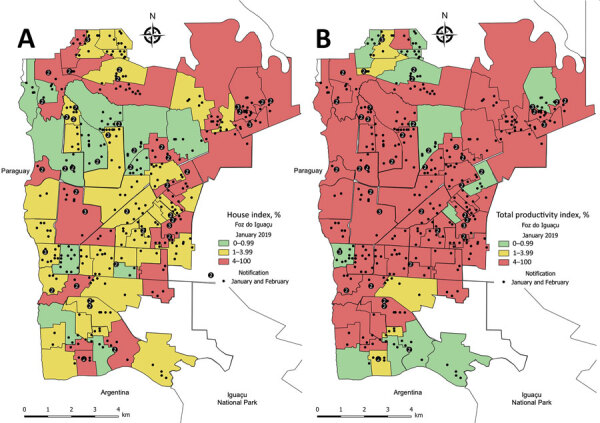
Choropleth maps comparing larval and adult Aedes aegypti mosquito infestation indices and dengue notifications in 73 urban areas of Foz do Iguaçu, Brazil, January–February 2019. A) Traditional house index (HI) calculated from larval surveys; B) trap positivity index (TPI) calculated from dengue virus positivity among captured adult Ae. aegypti mosquitoes. Dots represent dengue notification and numbers inside dots represent the total of dengue cases reported on that city block.