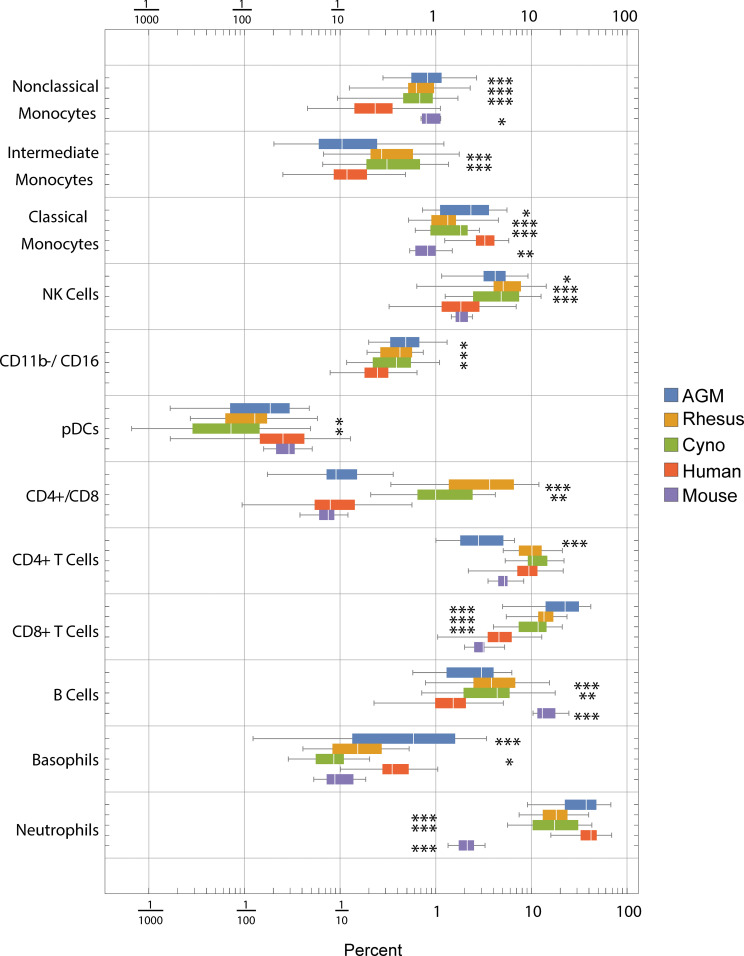
Figure 2.
Frequencies (percent of total) of gated cell types by species. Center line: median; Box: 25th to 75th quantile; Whiskers: 1.5x interquartile range. Statistics: ANOVA with Bonferroni post-test was calculated for each population. Asterisks indicate species that are significantly different from humans *p < 5x10⁻², **p < 1x10⁻², ***p < 1x10⁻³ after Bonferroni correction.

