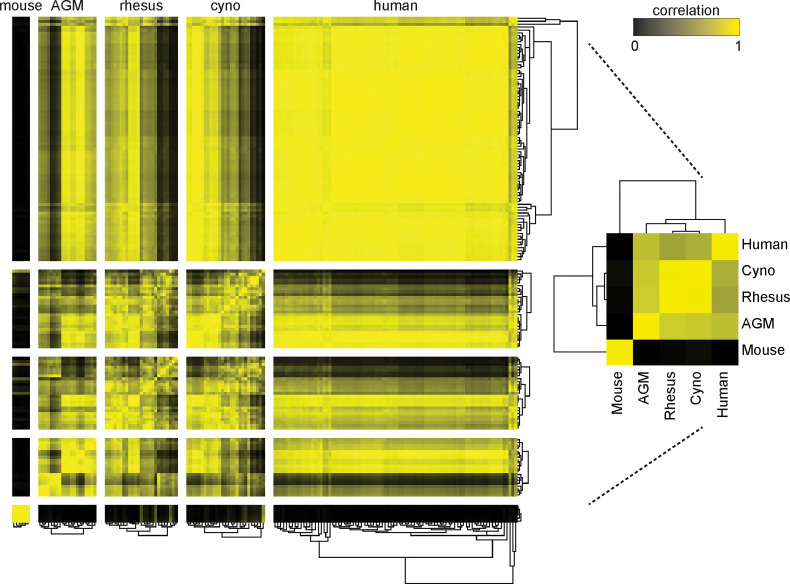
Figure 3.
Clustering of species by their cell type frequencies recapitulates the evolutionary tree. The average frequencies of 10 cell types (Neutrophils, Basophils, B Cells, CD8+ T Cells, CD4+ T Cells, CD4+/CD8+ T Cells, pDCs, NK Cells, Classical Monocytes and Nonclassical Monocytes) in each species was calculated and then clustered according to their pairwise correlations between species (right). This major clustering order was preserved in the larger heatmap (left), in which each individual donor is displayed and clustered by their individual cell type frequencies. Metric: PearsonCorrelation[freqs_species_1, freqs_species_2]2; distance function: Euclidean; linkage: average.

