Figure 1.
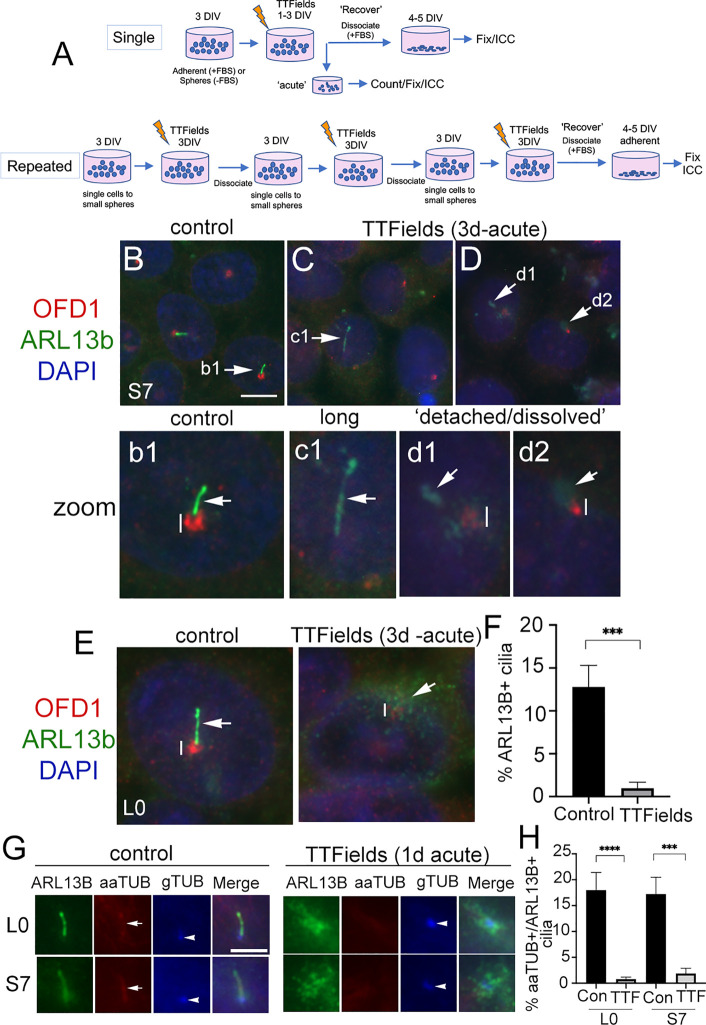
Primary cilia on patient-derived glioma cells are ablated by TTFields. (A) General approach to treat cells with a single or repeated exposure to TTFields in vitro. Cells that were grown adherent on glass coverslips had media supplemented with 10% fetal bovine serum (FBS). (B–D) S7 control cells stained for OFD1 (red), which clusters around basal bodies/centrioles, and ARL13B (green) which are enriched in the primary cilium. Nuclei are labeled with DAPI (blue). In control (B), ARL13B+ cilia (arrow in b1 zoom) from OFD1+ puncta (vertical line). In S7 TTFields-treated cells (C, D), ARL13B+ cilia appeared elongated (e.g., c1), detached, or separated away from the OFD1+ basal body (e.g., d1) or somewhat dissolved or cloudy in appearance at OFD1 clusters (e.g., d2). OFD1 clusters in TTFields-treated cells appeared smaller/less intense compared with control (compare vertical lines between b1 and d1/d2). (E) Control or 3 days of TTFields-treated L0 cells stained similar to (B). Control cells display clear OFD1+ basal body (vertical line) at the base of ARL13B+ cilia (arrow). TTFields-treated cells displayed less intensely labeled OFD1+ basal body (vertical line) with surrounding dispersed/cloudy puncta of ARL13B (arrow). (F) Percent of ARL13B+ cilia in L0 cells in control vs. TTFields. (G) L0 (upper row) and S7 (bottom row) cells stained for ARL13B (green), acetylated alpha tubulin (aaTUB, red), and gamma-tubulin (gTUB, blue). Control cells show ARL13B+ cilia colocalized with aaTUB (arrow) with gTUB+ basal bodies (arrowheads). TTFields-treated cells have clustered/dispersed ARL13B signal with no clear aaTUB+ axoneme associated with the gTUB+ basal body. (H) Percent of aaTUB+/ARL13B+ cilia in control or TTFields-treated L0 and S7 cells. *** p < 0.001, **** p < 0.0001 (ANOVA). Scale bars (in µm) = 10 (B) and 5 (G).

