Figure 3.

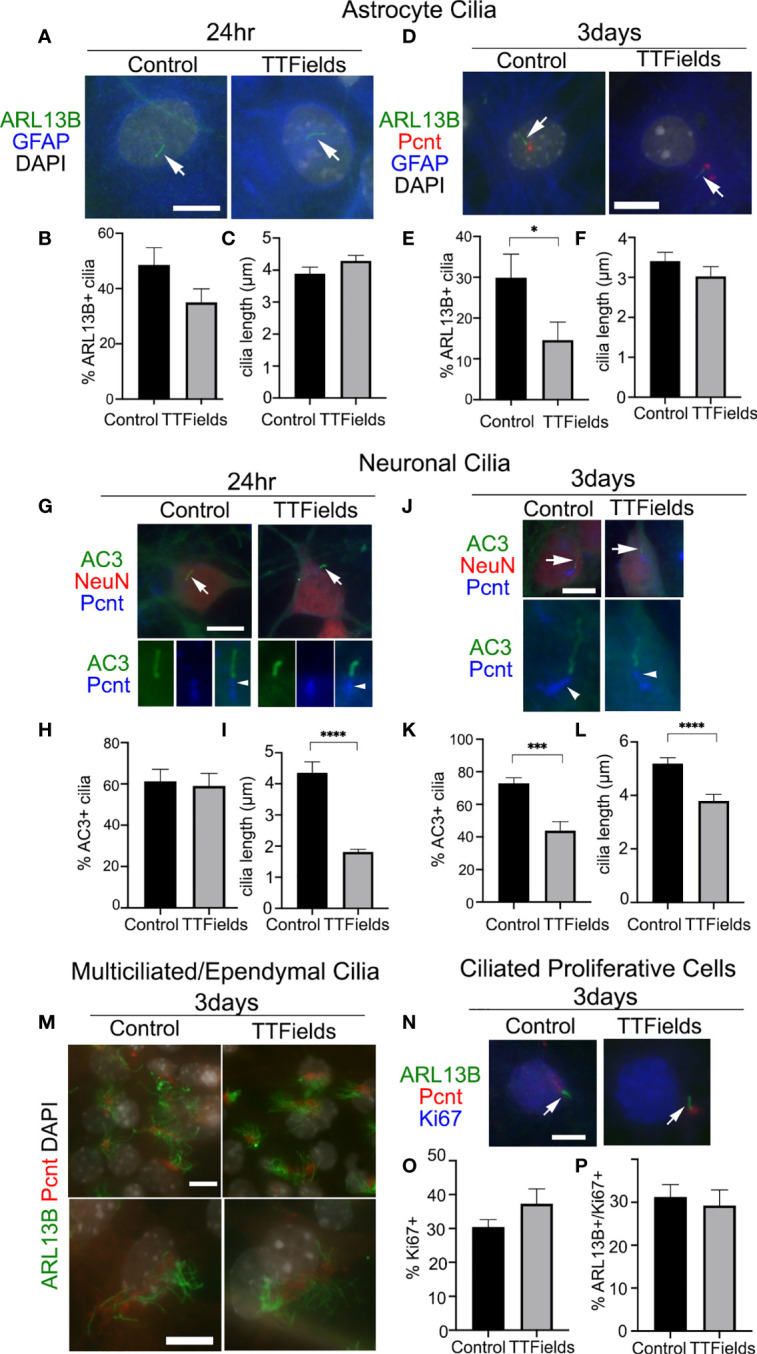
Effects of TTFields on normal mouse neural cell types in vitro. Mixed primary cultures from neonatal mouse cerebral cortex were dissociated and maintained for 11DIV and left untreated (Control) or exposed to 24 h or 3 days of continuous TTFields and fixed. (A) Cells were stained for ARL13B (green) and GFAP (blue) after 24 h TTFields. Nuclei were labeled with DAPI. Arrows point to ARL13B+ cilia in both groups at 24 h. (B) Percent of GFAP+ cells with ARL13B+ cilia and (C) mean length of ARL13B+ cilia on GFAP+ cells after 24 h. (D) Cells were stained for ARL13B (green), pericentrin (Pcnt, red), and GFAP (blue) after 3 days of TTFields. (E) Percent of GFAP+ cells with ARL13B+ cilia and (F) mean length of ARL13B+ cilia on GFAP+ cells after 3 days. (G) Cells were stained for type 3 adenylyl cyclase (AC3) (green), NeuN (red), and Pcnt (blue) after 24 h TTFields. Nuclei were labeled with DAPI. The arrows in the upper panels point to cilia enlarged below each image showing Pcnt+ basal bodies for indicated cilia. (H) Percent of NeuN+ cells with AC3+ cilia and (I) mean length of ARL13B+ cilia on NeuN+ cells after 24 h TTFields. (J) Cells were stained for AC3 (green), NeuN (red), and Pcnt (blue) after 3 days of TTFields. The arrows in the upper panels point to cilia enlarged below each image which shows the Pcnt+ basal bodies for indicated cilia. (K) Percent of NeuN+ cells with AC3+ cilia and (L) mean length of ARL13B+ cilia on NeuN+ cells after 3 days of TTFields. (M) Cells were stained with ARL13B (green) and Pcnt (red) with nuclei labeled with DAPI (white). Lower magnification (upper panels) and enlarged (lower panels) examples of multiciliated cells in control (left panels) and 3 days of TTFields (right panels). Bars = 10 µm. (N) Cells were stained for ARL13B (green), Pcnt (red), and Ki67 (blue) after 3 days of TTFields. Images show examples of Ki67+ nuclei with ARL13B+ cilia (arrows) extending from Pcnt+ basal bodies. (O) Percent of Ki67+ cells per field analyzed in each group. (P) Percent of Ki67+ cells with ARL13B+ cilia. * p < 0.05; *** p < 0.001; **** p < 0.0001 (ANOVA).
