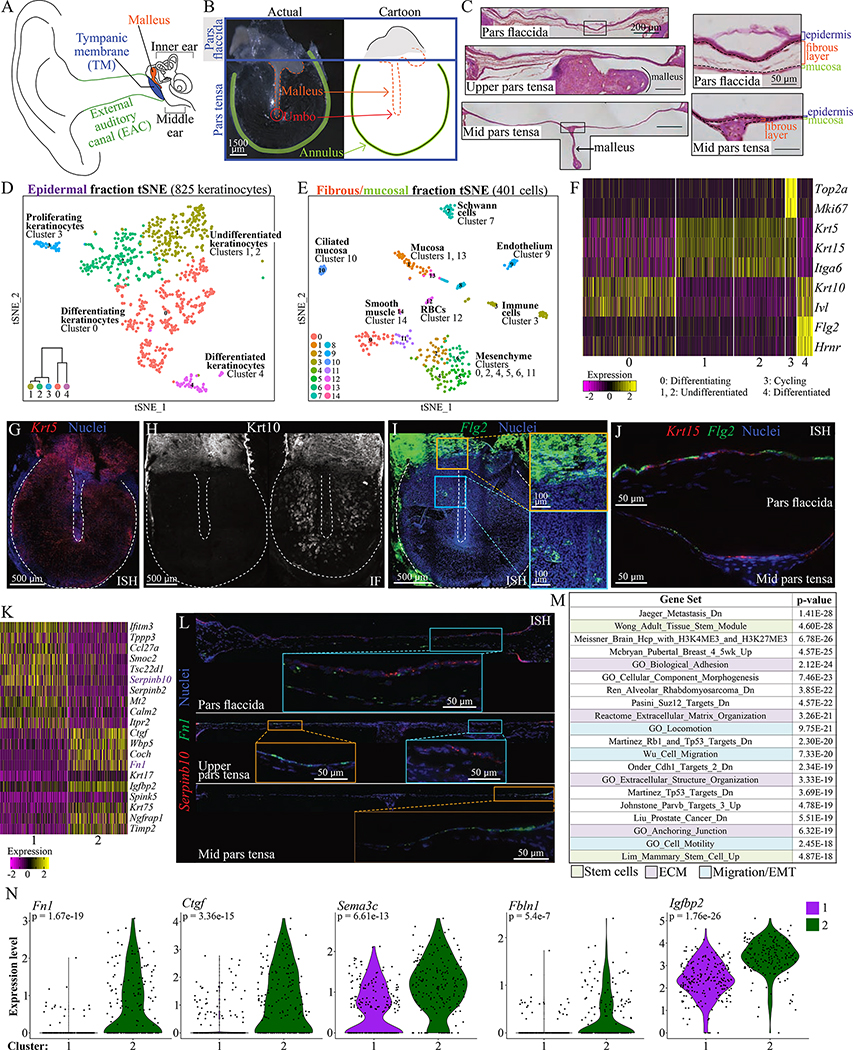
Figure 1: Single-cell RNA sequencing identifies cell types in the murine TM.
(A) Diagram of the ear. (B) A murine TM dissected en bloc and a cartoon representation. (C) TM sections at the pars flaccida (top), upper pars tensa (middle) and mid pars tensa (bottom) with scale bar = 200 μm. Tissue layers are indicated in magnified regions to the right, with scale bar = 50 μm. (D) t-Distributed Stochastic Neighbor Embedding (tSNE) visualization of keratinocyte clusters in the epidermis. The dataset includes 93 cells of mesenchymal, mucosal, or immune types not represented. Dendrogram inset was created with Morpheus and the top 100 differentially upregulated genes in each group (“Morpheus,” n.d.). (E) tSNE of clusters in the fibrous/mucosal fraction. (F) Heat-map showing expression of genes associated with proliferation and differentiation in the keratinocyte clusters. Each column is a cell. (G) ISH for Krt5 in a whole-mount TM. (H) Immunofluorescence (IF) for Krt10 in two whole-mount TMs, illustrating extremes of K10+ cell distribution. (I) ISH for Flg2 in a whole-mount TM. The yellow inset is at the pars flaccida/pars tensa junction; the blue inset is an area of the pars tensa over the malleus. (J) ISH for Flg2 and Krt15 in TM sections. Epidermis is oriented upward. (K) Heat-map showing genes differentially expressed between keratinocyte clusters 1 and 2. (L) ISH for Serpinb10 and Fn1 in TM sections from the pars flaccida (top, ~1500 μm across), upper pars tensa (middle, ~1650 μm across), and mid pars tensa (bottom, ~1800 μm across). Epidermis is oriented upward. (M) Top MSigDB gene sets enriched for genes at least 1.2-fold and significantly upregulated in keratinocyte cluster 2 relative to 1. (N) Violin plots showing expression of Fn1, Ctgf, Sema3c, Fbln1, and Igfbp2 in cells from keratinocyte clusters 1 and 2. Images in C, G-J, and L were acquired in tiles and stitched. Images in G-I are maximum projections of z-stacks. See also Figures S1–3 and Tables S1–2.

