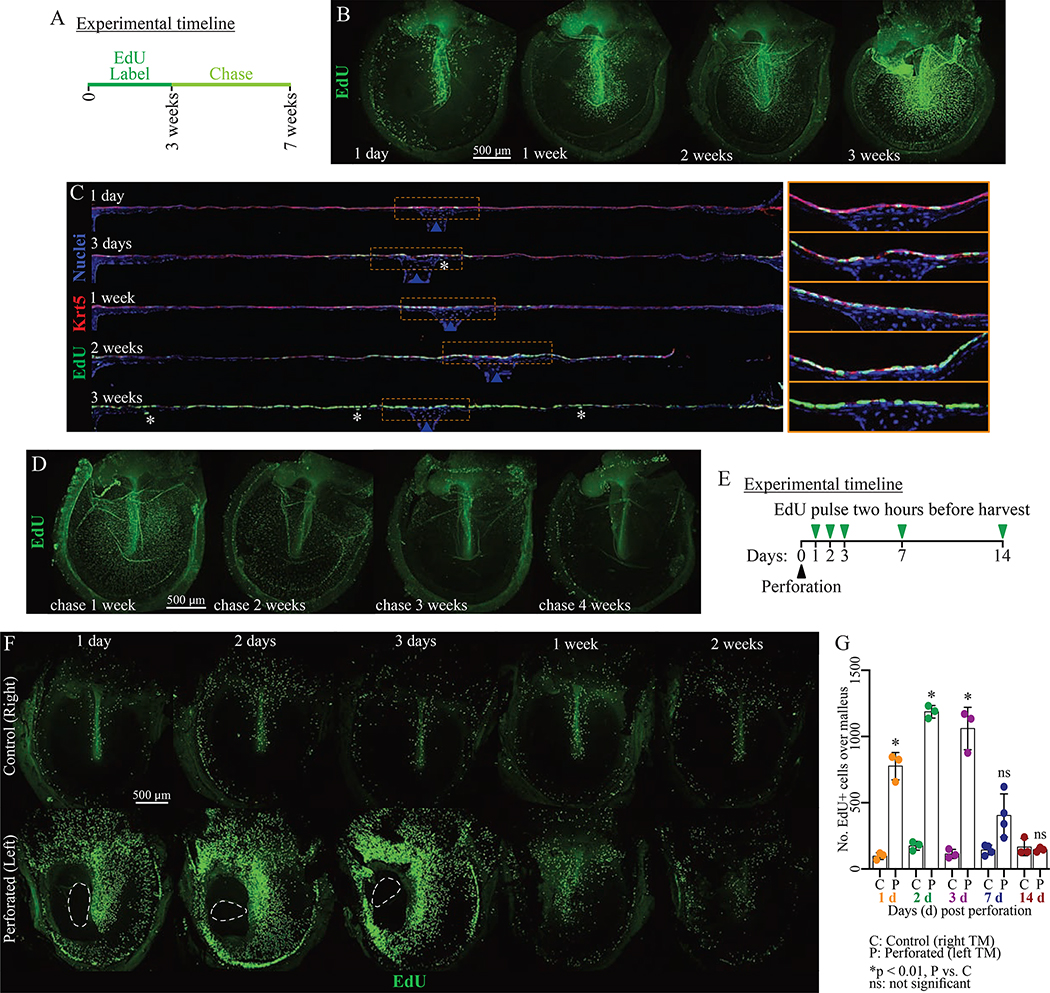
Figure 3: The murine TM epidermis turns over rapidly.
(A) Pulse-chase experiment timeline. Mice were exposed to EdU continuously for 3 weeks (pulse), then the label allowed to dilute for 4 weeks (chase). (B, D) Representative whole-mount TMs at indicated (B) pulse and (D) chase timepoints and stained for EdU. (C) Mid-malleus sections (~1700 μm across) at indicated pulse timepoints stained for EdU and Krt5. Images were acquired in tiles and stitched, and TMs were artificially straightened in ImageJ. Asterisks indicate EdU+/Krt5- cells. Blue arrows indicate the malleus. Regions within yellow rectangles are magnified and not straightened to the right. (E) Perforation experiment timeline. (F) Representative whole-mount TMs from perforated (left) and control (right) TMs stained for EdU. On days 1–3, the dashed line indicates the perforation. (G) Number of EdU+ cells in a 400×1200 μm area over the malleus in the perforation time-course. Each dot is 1 TM; 3 animals were analyzed per timepoint. Histogram indicates mean and error bars standard deviation. Results of t-tests for control versus perforated TMs at a single timepoint are indicated. Throughout, scale bars apply to all images in a panel. Images in B, D and F are maximum projections of z-stacks. See also Figure S4.

