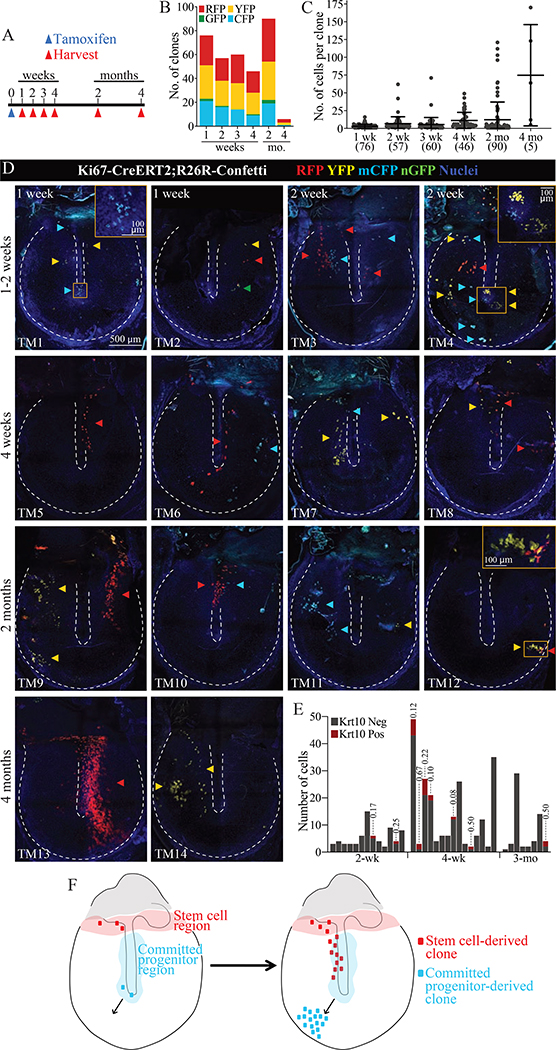
Figure 5: Single TM keratinocyte clones arise from distinct stem cell and committed progenitor populations.
(A) Lineage tracing timeline. (B) Number of pars tensa clones expressing each fluorescent proteins. (C) Number of cells per pars tensa clone. Each dot represents a clone, and the error bars show mean and standard deviation. The total number of clones is indicated parenthetically below the x-axis. The large RFP+ clone captured at 4 months in panel (D), TM13, is not included as it could not be accurately quantified. (D) Examples of TMs from the indicated timepoints, with arrowheads annotating individual clones. The annulus and malleus are outlined by dotted lines. The 500 μm scale bar applies to all whole-mount panels. Images were acquired in tiles and stitched and are maximum projections of z-stacks. (E) IF for Krt10 was done on a subset of TMs. Each histogram bar is one clone. For clones with Krt10+ cells, the Krt10+ proportion is indicated above the bar. (F) Model of the location of stem cells and committed progenitors of the murine TM epidermis.

