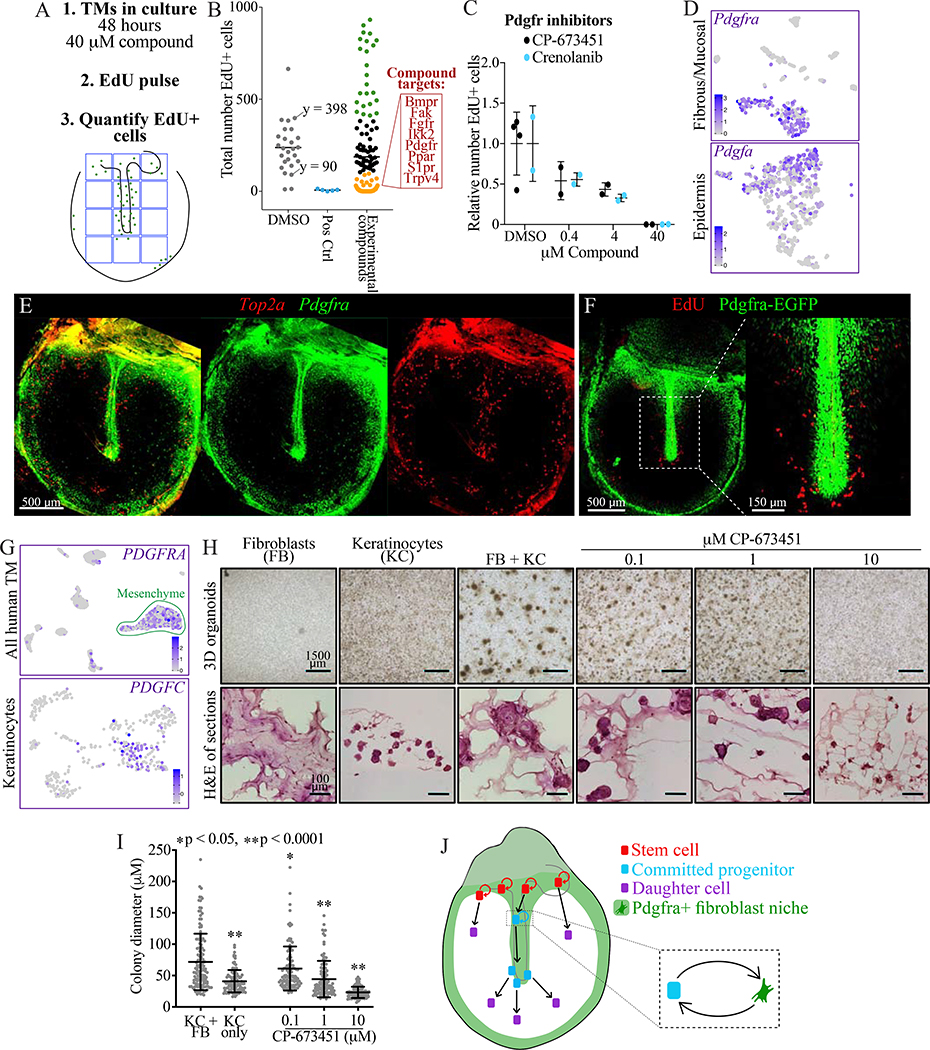
Figure 7: Pdgfra signaling in fibroblasts supports turnover of mouse and human TM keratinocytes.
(A) Approach for screening compounds in TM explants. (B) Screen results. The numbers of EdU+ cells in 1,200×1,600 μm areas of the TMs are plotted; each dot is one TM, with a bar indicating mean. DMSO was the negative control and inhibitors of Cdk and Aurka were positive controls. Of TMs treated with one of 71 experimental compounds, data points are colored in black in the DMSO-treated range (90 – 398), in green if >398, and in gold if <90. In the red box are targets for which every compound tested fell in the gold range. (C) Relative number of EdU+ cells in TMs cultured for 48 hours in vehicle or the indicated concentrations of Pdgfra inhibitors. Each dot is a TM and the error bars show mean and standard deviation (SD). (D) tSNEs showing expression of Pdgfra in the murine TM fibrous/mucosal fraction and of Pdgfa in the murine TM epidermis. (E) ISH for Pdgfra and Top2a in a wild-type whole-mount TM. The middle and right panels show each stain independently. (F) Whole-mount TM from a Pdgfra-EGFP mouse injected with EdU and sacrificed 24 hours later. (G) UMAPs showing expression of PDGFRA in the full human TM scRNA-Seq dataset and of PDGFC in the isolated keratinocyte dataset. (H) Organoid cultures of fibroblasts (FB) and keratinocytes (KC) from human TMs, seeded separately or in co-culture and treated with CP-673451. Top: images of 3D cultures. Bottom: H&E stained sections. (I) Quantification of organoid size; each dot is a cell cluster and error bars show mean and SD. Statistical significance of each condition compared to KC+FB, calculated with one-way ANOVA, is indicated. (J) Cartoon summarizing our findings. Fibroblasts create a niche supporting proliferation of keratinocyte stem cells and committed progenitors, while keratinocytes not in proximity to this niche migrate but do not proliferate. Images in E, F, and H (bottom) were acquired in tiles and stitched; images in E and F are maximum projections of z-stacks. See also Figures S6–7 and Table S5.

