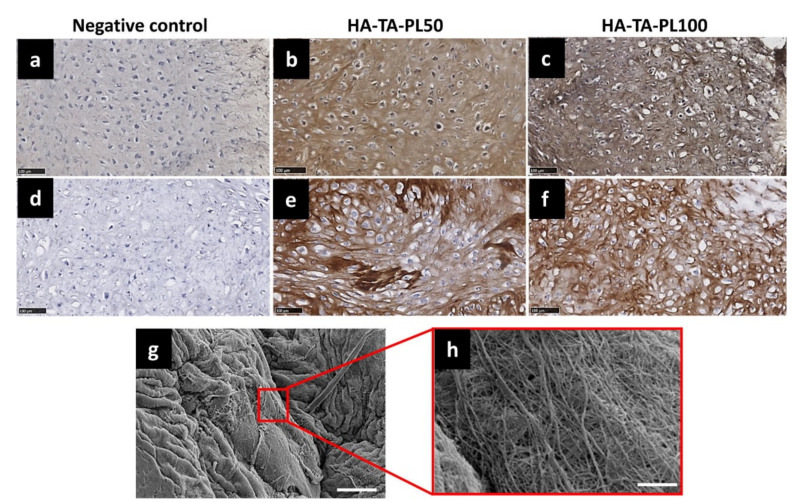
Figure 4.
Analysis of collagen production. Immunohistochemical staining of COL II, (a) negative control, (b) HA-TA-PL50, (c) HA-TA-PL100 hydrogels, and COL I, (d) negative control, (e) HA-TA-PL50 and (f) HA-TA-PL100 hydrogels at day 28 of chondrogenesis. For the negative control, the staining procedure was performed without using a primary antibody. Scale bar is 100 µm. (g) SEM image of the produced collagen fibers in HA-TA-PL100 sample after 35 days of chondrogenesis. Scale bar is 10 µm, (h) magnification of the fibrous matrix, scale bars are 1 µm (reprinted with the permission from [52]).

