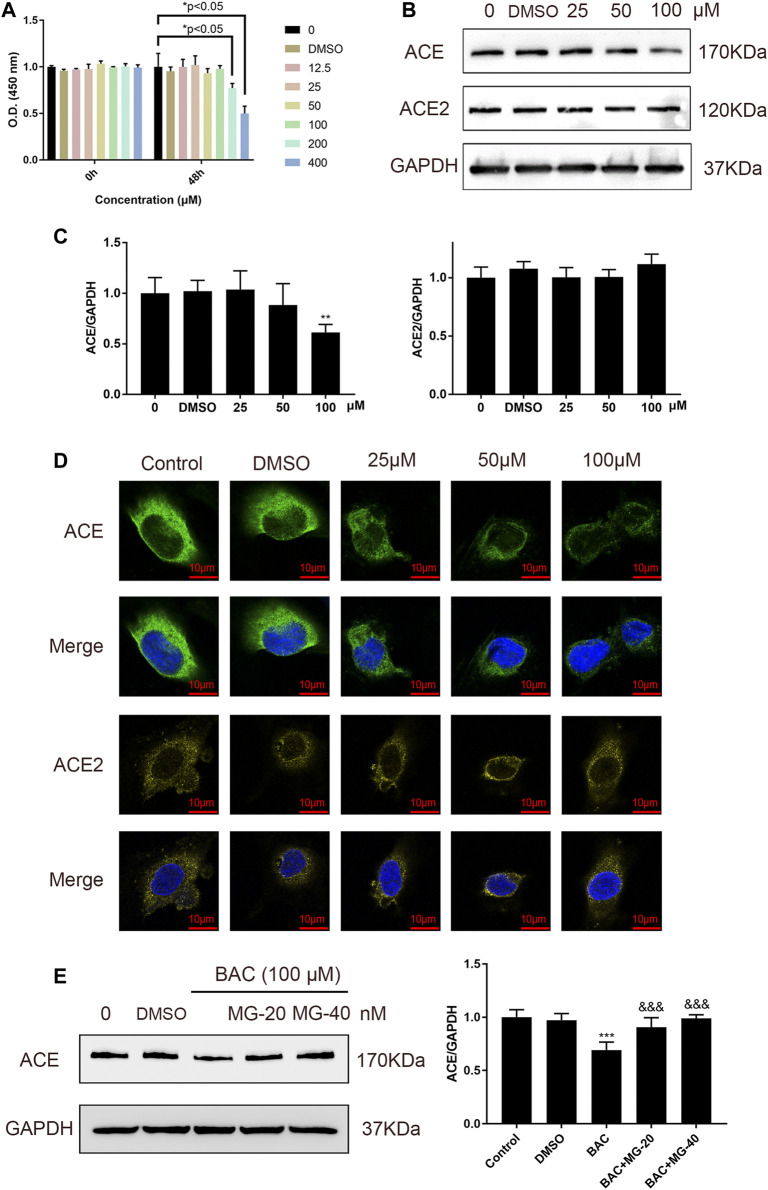
FIGURE 4.
BAC inhibited ACE directly in HUVECs. (A) Starved HUVECs were preconditioned with a series of BAC (0, 12.5, 25, 50, 100, 200, and 400 μM) or with 0.1% DMSO for 48 h and then measured by CCK-8 assay (n = 3) at 450 nm. *p < 0.05 compared with 0 group. (B,C) After being starved, HUVECs were treated with serial concentrations of BAC (0, DMSO, 25, 50, and 100 μM) for 24 h to extract protein, and the protein quantity of ACE and ACE2 was detected by Western blot. The gray value of protein was determined by ImageJ. (D) Representative image of fluorescence immunoassay for protein expression and fluorescence localization of ACE and ACE2. Starved HUVECs were treated with serial concentrations of BAC (0, DMSO, 25, 50, and 100 μM) for 24 h and measured by fluorescence immunoassay. (E) After being starved, HUVECs were treated with BAC (100 μM) and with or without MG132 at 20 nM or 40 nM for 24 h. The protein quantity of ACE was detected by Western blot. The gray value of protein was determined by ImageJ. The value was expressed by mean ± SEM. **p < 0.05, ***p < 0.05, as compared with the 0 group.

