FIGURE 4.
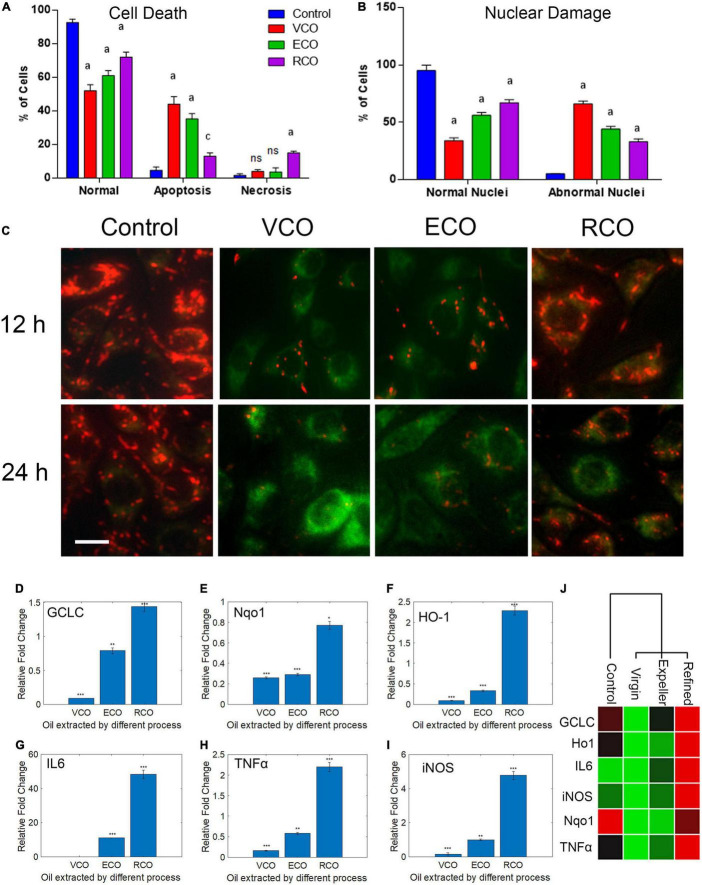
Effect of CO extraction process (VCO, ECO and RCO) on SH-SY5Y cells: (A) Bar chart indicating the percentage of normal, apoptosis, and necrotic cells. (B) Bar chart indicating the percentage of normal and abnormal nuclei. Triplicate measurements were taken. Data were represented as mean ± SD (aP < 0.05 and cP < 0.001 were considered statistically significant, “ns” represents not significant). (C) Determination of mitochondrial trans-membrane potential (Δψm). JC- 1 staining of control, VCO, ECO, and RCO treated SH-SY5Y cells incubated for 12 and 24h, post incubation JC1 staining was performed and imaged (scale bar, 10 μm). Figure shows the dose and time dependent effect of oils extracted by various processes on mitochondrial trans-membrane potential (Δψm). Differential modulation of antioxidant genes in oil treated SH-SY5Y cells extracted by different processes (VCO, ECO, and RCO) in neuroblastoma cells: (D) GCLC, (E) Nqo1, (F) HO-1 and inflammatory genes, (G) IL6, (H) TNFα and (I) iNOS measured by RT-qPCR. GAPDH was used as the control for PCR experiments. Data represent mean ± SD (n = 3); *p < 0.05, **p < 0.001. (J) Heat map representing the different expression between groups with ranked lists of genes from high (red) to low (green) in SH-SY5Y cells (P < 0.05).

